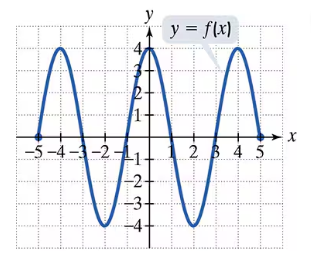
Give a rule for each piecewise-defined function. Also give the domain and range.
Table of contents
- 0. Review of Algebra4h 18m
- 1. Equations & Inequalities3h 18m
- 2. Graphs of Equations1h 43m
- 3. Functions2h 17m
- 4. Polynomial Functions1h 44m
- 5. Rational Functions1h 23m
- 6. Exponential & Logarithmic Functions2h 28m
- 7. Systems of Equations & Matrices4h 5m
- 8. Conic Sections2h 23m
- 9. Sequences, Series, & Induction1h 22m
- 10. Combinatorics & Probability1h 45m
3. Functions
Intro to Functions & Their Graphs
Problem 67
Textbook Question
In Exercises 65–70, use the graph of f to find each indicated function value. f(4)

Verified step by step guidance1
Identify the point on the graph where the input value (x) is 4.
Locate the vertical line corresponding to x = 4 on the x-axis.
Find the point on the curve of the function f(x) that intersects this vertical line.
Determine the y-coordinate of this intersection point, which represents the value of f(4).
Read the y-value from the graph at x = 4 without calculating, just noting the position on the y-axis.
Verified video answer for a similar problem:This video solution was recommended by our tutors as helpful for the problem above
Video duration:
1mPlay a video:
Was this helpful?
Key Concepts
Here are the essential concepts you must grasp in order to answer the question correctly.
Function and Function Notation
A function assigns each input exactly one output. The notation f(x) represents the output value of the function f at the input x. Understanding this notation is essential to interpret and evaluate function values from graphs or equations.
Recommended video:
Function Composition
Reading Values from a Graph
To find f(4) from a graph, locate the input value x = 4 on the x-axis, then find the corresponding point on the curve. The y-coordinate of this point is the function value f(4). This skill is crucial for interpreting graphical data.
Recommended video:
Guided course
Graphs & the Rectangular Coordinate System
Properties of Sinusoidal Functions
Sinusoidal functions, like sine and cosine, have wave-like patterns with regular peaks and troughs. Recognizing these patterns helps predict function values and understand periodic behavior, which is useful when analyzing graphs of such functions.
Recommended video:
Change of Base Property
Watch next
Master Relations and Functions with a bite sized video explanation from Patrick
Start learningRelated Videos
Related Practice
Textbook Question
2
views
