

Ch. 4 - Exponential and Logarithmic Functions
Blitzer - College Algebra 8th Edition
Blitzer8th EditionCollege AlgebraISBN: 9780136970514Not the one you use?Change textbook
Chapter 5, Problem 40

In Exercises 39–40, graph f and g in the same rectangular coordinate system. Use transformations of the graph of f to obtain the graph of g. Graph and give equations of all asymptotes. Use the graphs to determine each function's domain and range. f(x) = ln x and g(x) = - ln (2x)
Graph of f(x) = ln x (red) and g(x) = -ln(2x) (blue) with asymptotes and key points.
Graph of g(x) = -ln(2x) (red) and f(x) = ln x (blue) with transformations and key points.
Graph of f(x) = ln x (red) and g(x) = -ln(2x) (blue) with asymptotes and key points.
Graph of g(x) = -ln(2x) (red) and f(x) = ln x (blue) with transformations and key points.

Verified step by step guidance
1
Step 1: Begin by analyzing the given functions f(x) = ln(x) and g(x) = -ln(2x). The function f(x) = ln(x) is the natural logarithm function, which has a vertical asymptote at x = 0 and is defined for x > 0. The function g(x) = -ln(2x) involves a reflection across the x-axis and a horizontal compression by a factor of 2.
Step 2: Identify the transformations applied to f(x) to obtain g(x). The negative sign in g(x) = -ln(2x) reflects the graph of f(x) across the x-axis, and the factor of 2 inside the logarithm compresses the graph horizontally. This means that for g(x), the x-values are scaled by a factor of 1/2 compared to f(x).
Step 3: Determine the asymptotes for both functions. For f(x) = ln(x), the vertical asymptote is at x = 0 because the natural logarithm is undefined for x ≤ 0. Similarly, g(x) = -ln(2x) also has a vertical asymptote at x = 0, as the argument of the logarithm (2x) must be positive.
Step 4: Use the graphs to determine the domain and range of each function. For f(x) = ln(x), the domain is (0, ∞) and the range is (-∞, ∞). For g(x) = -ln(2x), the domain is also (0, ∞), but the range is (-∞, ∞) due to the reflection across the x-axis.
Step 5: Plot key points to verify the transformations. For f(x), key points include (1, 0) and (e, 1). For g(x), the corresponding points after transformation are (0.5, 0) and (e/2, -1). These points confirm the horizontal compression and reflection applied to f(x) to obtain g(x).

Verified video answer for a similar problem:

This video solution was recommended by our tutors as helpful for the problem above.
Video duration:
15m
Was this helpful?

Key Concepts

Here are the essential concepts you must grasp in order to answer the question correctly.

Logarithmic Functions

Logarithmic functions, such as f(x) = ln(x), are the inverses of exponential functions. They are defined for positive real numbers and have a vertical asymptote at x = 0. Understanding their properties, including their domain, range, and behavior as x approaches the asymptote, is crucial for graphing and analyzing transformations.
Recommended video:
5:26
Graphs of Logarithmic Functions

Transformations of Functions

Transformations involve shifting, reflecting, stretching, or compressing the graph of a function. For example, g(x) = -ln(2x) represents a vertical reflection of f(x) = ln(x) and a horizontal compression. Recognizing how these transformations affect the graph helps in visualizing and deriving the new function's characteristics from the original.
Recommended video:
4:22
Domain & Range of Transformed Functions

Asymptotes

Asymptotes are lines that a graph approaches but never touches. For logarithmic functions, vertical asymptotes occur where the function is undefined, such as at x = 0 for f(x) = ln(x). Identifying asymptotes is essential for understanding the behavior of the function at its boundaries and for determining the domain and range of the functions involved.
Recommended video:
6:24
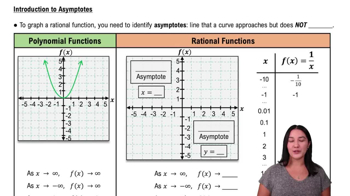
Introduction to Asymptotes
Related Practice
Textbook Question

Use properties of logarithms to condense each logarithmic expression. Write the expression as a single logarithm whose coefficient is 1. Where possible, evaluate logarithmic expressions without using a calculator. log 5 + log 2

1032
views
Textbook Question

The figure shows the graph of f(x) = ex. In Exercises 35-46, use transformations of this graph to graph each function. Be sure to give equations of the asymptotes. Use the graphs to determine graphs. each function's domain and range. If applicable, use a graphing utility to confirm your hand-drawn h(x) = ex-1+2

781
views
Textbook Question

Use properties of logarithms to expand each logarithmic expression as much as possible. Where possible, evaluate logarithmic expressions without using a calculator. log(10x21x37(x+1)2)\(\log\) \(\left\)( \(\frac{10x^2 \sqrt[3]{1 - x}\)}{7(x + 1)^2} \(\right\))

917
views
Textbook Question

Evaluate each expression without using a calculator. log5 57

806
views
Textbook Question

The figure shows the graph of f(x) = ex. In Exercises 35-46, use transformations of this graph to graph each function. Be sure to give equations of the asymptotes. Use the graphs to determine graphs. each function's domain and range. If applicable, use a graphing utility to confirm your hand-drawn h(x) = e-x

1039
views
Textbook Question

Solve each exponential equation in Exercises 23–48. Express the solution set in terms of natural logarithms or common logarithms. Then use a calculator to obtain a decimal approximation, correct to two decimal places, for the solution. 5(2x+3)=3(x−1)

898
views