Intro to Graph Theory: Videos & Practice Problems
Intro to Graph Theory focuses on representing real situations with a graph, where vertices stand for objects or locations and edges show the connections between them. A graph can model maps, bridges, train routes, and similar networks by translating relationships into a visual structure that is easier to read and analyze.
Key ideas include identifying the order of a graph, which means the number of vertices, and deciding whether two vertices are adjacent, meaning they share an edge. You should be able to count vertices and edges accurately and interpret what each part of the graph represents in context. This topic also develops the skill of matching a written description of connections to the correct graph by checking that every required edge is present and no important connection is missing.
Intro to Graph Theory


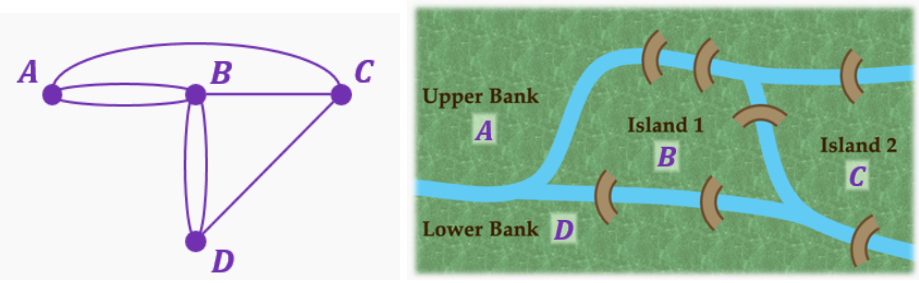
The graph below represents a map of Konigsberg, where vertices are land masses and edges are the bridges that connect them. Use the graph to answer the questions below.
Find the number of bridges (edges).
6
8
7
9
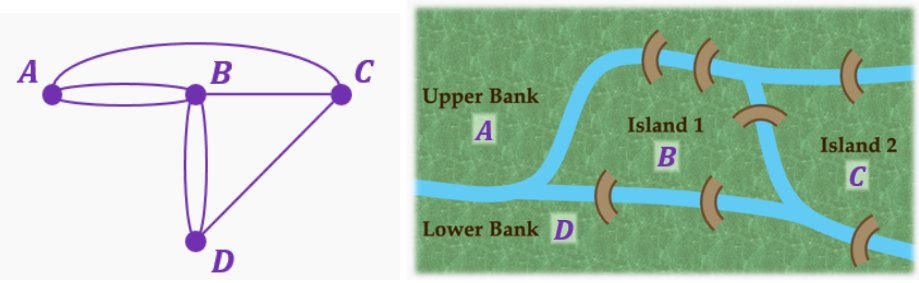
The graph below represents a map of Konigsberg, where vertices are land masses and edges are the bridges that connect them. Use the graph to answer the questions below.
What is the order of this graph? (order = number of vertices)
5
3
7
4
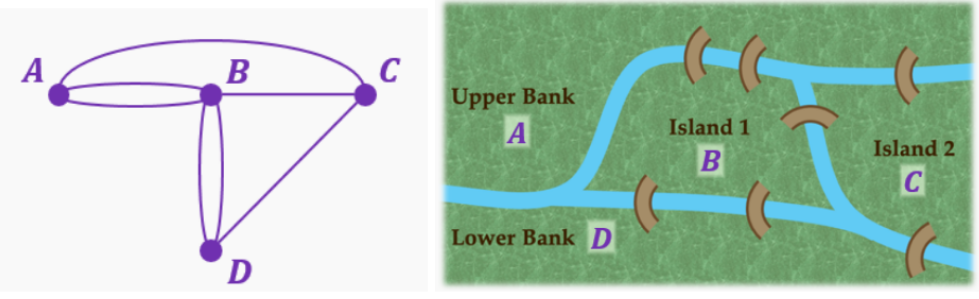
The graph below represents a map of Konigsberg, where vertices are land masses and edges are the bridges that connect them. Use the graph to answer the questions below.
Are landmasses B & C connected (adjacent)?
Yes
No
Not enough information to tell
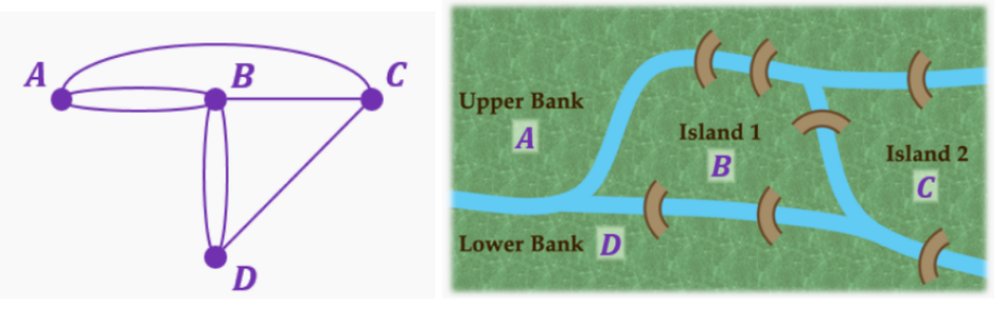
The graph below represents a map of Konigsberg, where vertices are land masses and edges are the bridges that connect them. Use the graph to answer the questions below.
Are landmasses A & D connected (adjacent)?
Yes
No
Not enough information to tell
Intro to Graph Theory Example 1
Intro to Graph Theory Example 2
Drawing Graphs to Model Situations
Drawing Graphs to Model Situations Example 3
Drawing Graphs to Model Situations Example 4
Drawing Graphs to Model Situations Example 5
Drawing Graphs to Model Situations Example 6
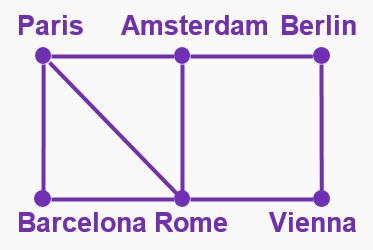
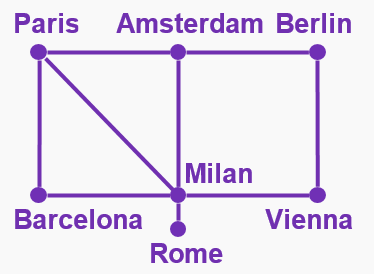
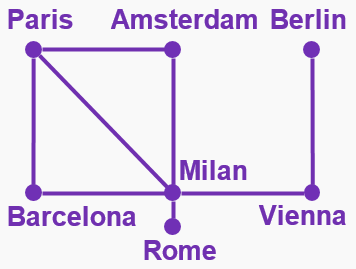
Select the graph that represents the following train routes between major European cities.
▸ Barcelona has trains that go to Paris and Milan.
▸ Paris has trains that go to Barcelona, Milan, and Amsterdam.
▸ Amsterdam has trains that go to Paris, Milan, and Berlin.
▸ Milan has trains that go to Barcelona, Paris, Amsterdam, Rome, and Vienna.
▸ Rome has a train that goes to Milan.
▸ Berlin has trains that go to Amsterdam and Vienna.
▸ Vienna has trains that go to Milan and Berlin
Here's what students ask on this topic:
In graph theory, a graph is a mathematical structure used to model pairwise relations between objects. It consists of vertices (or nodes) that represent objects or locations, and edges that represent connections or relationships between these vertices. For example, a graph can model a map where vertices are cities and edges are roads connecting them, or a network where vertices are computers and edges are communication links. This visual representation helps simplify complex relationships, making it easier to analyze connectivity, paths, and network structure in real-world scenarios.
The order of a graph is the number of vertices it contains. To determine the order, simply count all the distinct vertices in the graph. This measure is important because it gives a basic idea of the graph's size and complexity. Knowing the order helps in understanding the scale of the problem being modeled and is essential for analyzing properties like connectivity, degree of vertices, and for applying algorithms that depend on the number of vertices.
Two vertices in a graph are said to be adjacent if they are connected directly by an edge. This means there is a direct link or relationship between the two vertices without any intermediate vertices. Adjacency is a fundamental concept because it defines the immediate connections in the graph, which is crucial for understanding the structure, finding paths, and analyzing networks such as social connections or transportation routes.
To match a written description of connections to the correct graph, first identify all the vertices mentioned in the description. Then, list all the connections (edges) between these vertices as described. Next, examine the candidate graphs and check if each graph contains exactly the same vertices and edges as the description. The correct graph will have all the required edges present and no extra or missing connections. This process ensures the graph accurately represents the relationships described in the text.
To count the number of edges in a graph, carefully examine each pair of vertices and count every connection between them. For simple graphs, each edge connects two distinct vertices and is counted once. In graphs with loops or multiple edges between the same vertices, count each edge separately. Accurate counting is important for analyzing graph properties such as degree, connectivity, and for applying algorithms that depend on the number of edges.