Textbook Question
Use the Leading Coefficient Test to determine the end behavior of the graph of the polynomial function.
432
views
 Verified step by step guidanceVerified video answer for a similar problem:
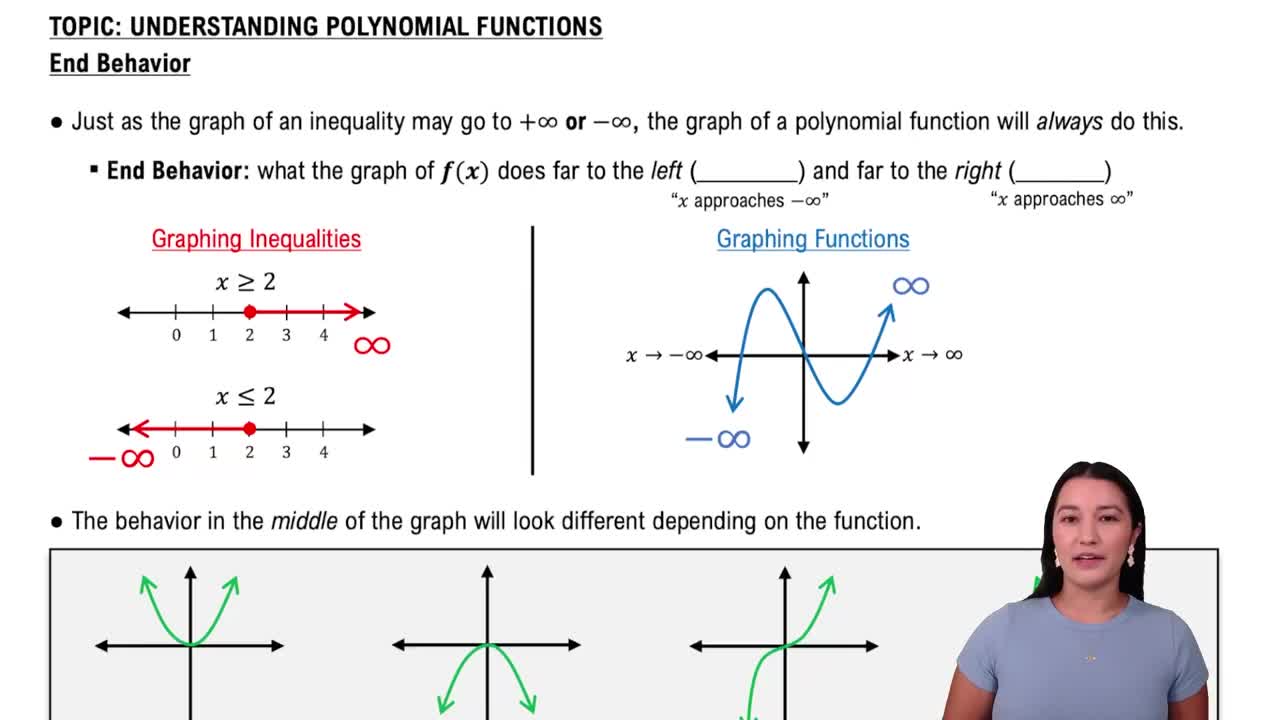
 06:08
06:08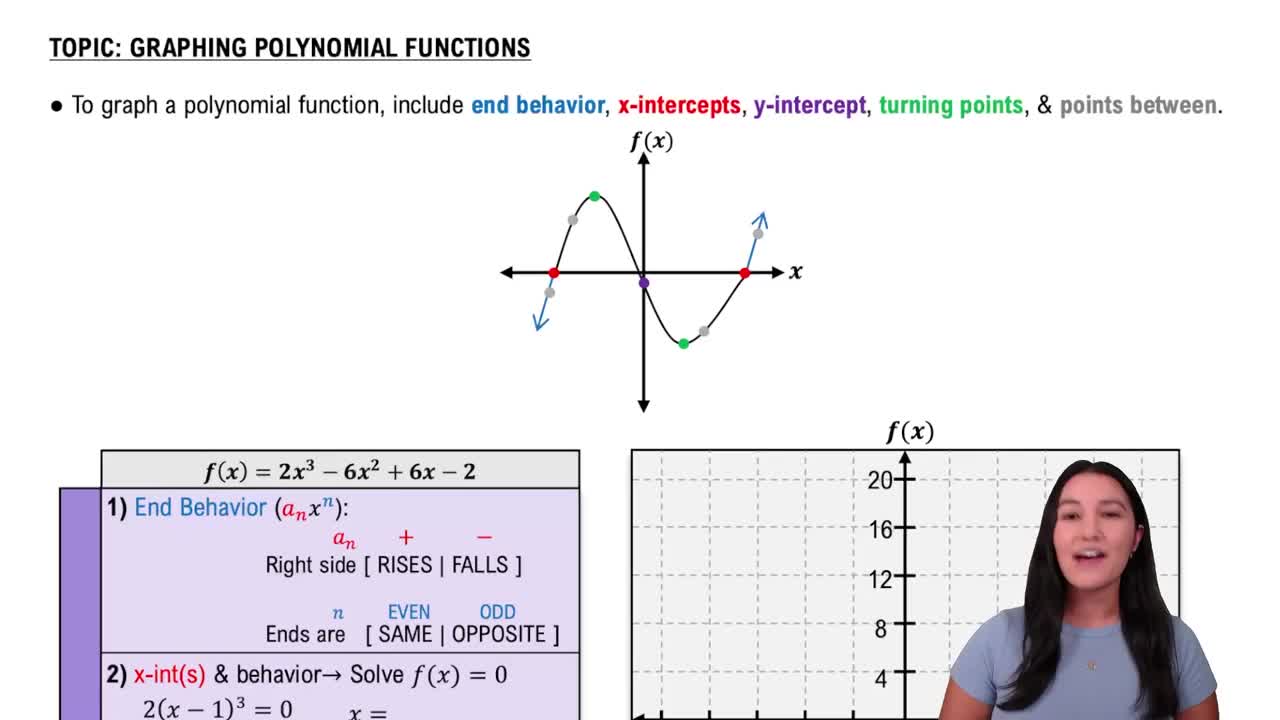 05:25 06:08
 5:01m
5:01mMaster Identifying Intervals of Unknown Behavior with a bite sized video explanation from Patrick
Start learning