
Textbook Question
Begin by graphing the square root function, f(x) = √x. Then use transformations of this graph to graph the given function. g(x) = √x + 1
717
views
 Verified step by step guidanceVerified video answer for a similar problem:
 5:26
5:26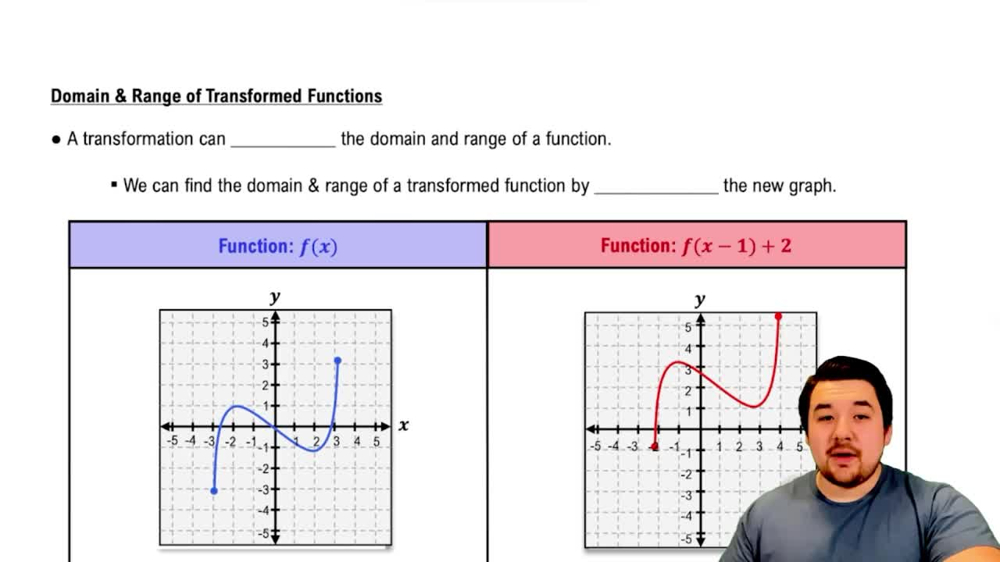 4:22
4:22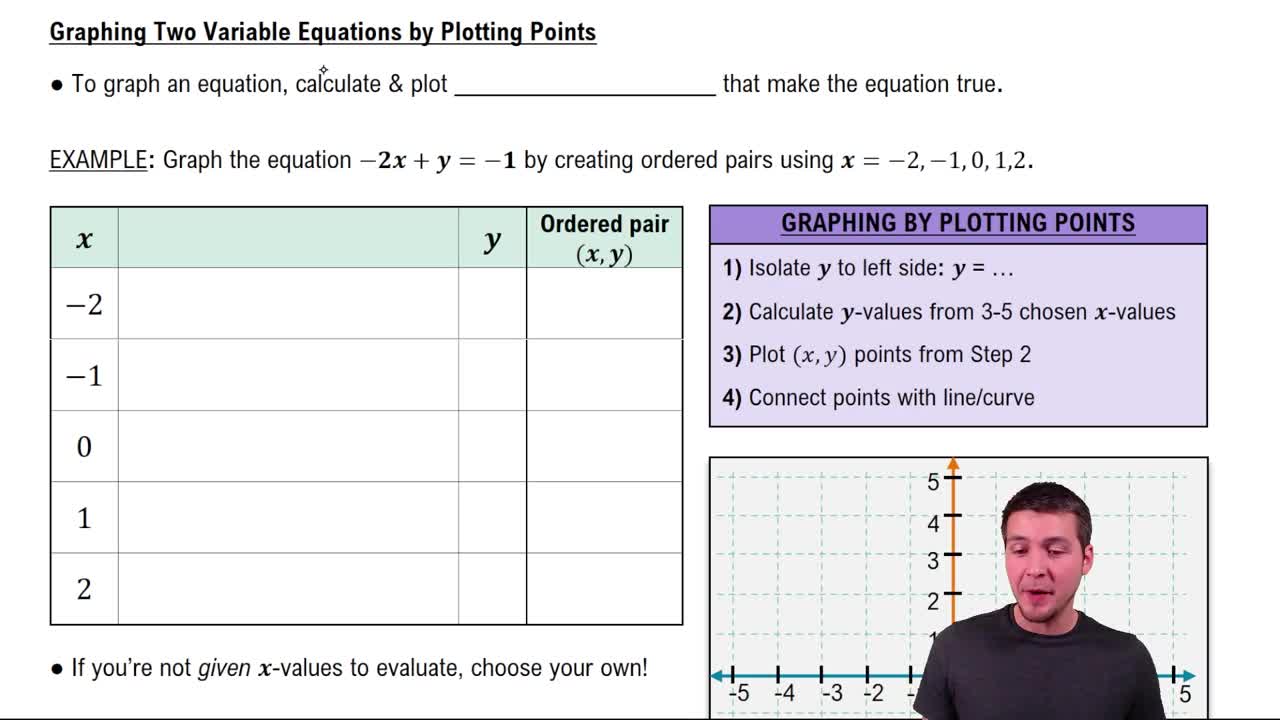 04:29
04:29