Use the Leading Coefficient Test to determine the end behavior of the graph of the polynomial function.
Table of contents
- 0. Review of Algebra4h 18m
- 1. Equations & Inequalities3h 18m
- 2. Graphs of Equations1h 43m
- 3. Functions2h 17m
- 4. Polynomial Functions1h 44m
- 5. Rational Functions1h 23m
- 6. Exponential & Logarithmic Functions2h 28m
- 7. Systems of Equations & Matrices4h 5m
- 8. Conic Sections2h 23m
- 9. Sequences, Series, & Induction1h 22m
- 10. Combinatorics & Probability1h 45m
4. Polynomial Functions
Understanding Polynomial Functions
Problem 25
Textbook Question
Use an end behavior diagram, as shown below, to describe the end behavior of the graph of each polynomial function. ƒ(x)=9x6-3x4+x2-2


Verified step by step guidance1
Identify the degree and leading coefficient of the polynomial function. Here, the function is \(f(x) = 9x^6 - 3x^4 + x^2 - 2\). The degree is 6 (the highest power of \(x\)), and the leading coefficient is 9.
Recall that the end behavior of a polynomial is determined by the degree and the leading coefficient. Since the degree is even (6) and the leading coefficient is positive (9), the ends of the graph will both point upwards.
Use the general rule for end behavior: For even degree and positive leading coefficient, as \(x \to \infty\), \(f(x) \to \infty\), and as \(x \to -\infty\), \(f(x) \to \infty\).
Represent this behavior in an end behavior diagram, which typically shows arrows indicating the direction of the graph as \(x\) approaches positive and negative infinity. Both arrows should point upwards.
Summarize the end behavior: The graph rises to the right and rises to the left, reflecting the polynomial's even degree and positive leading coefficient.
Verified video answer for a similar problem:
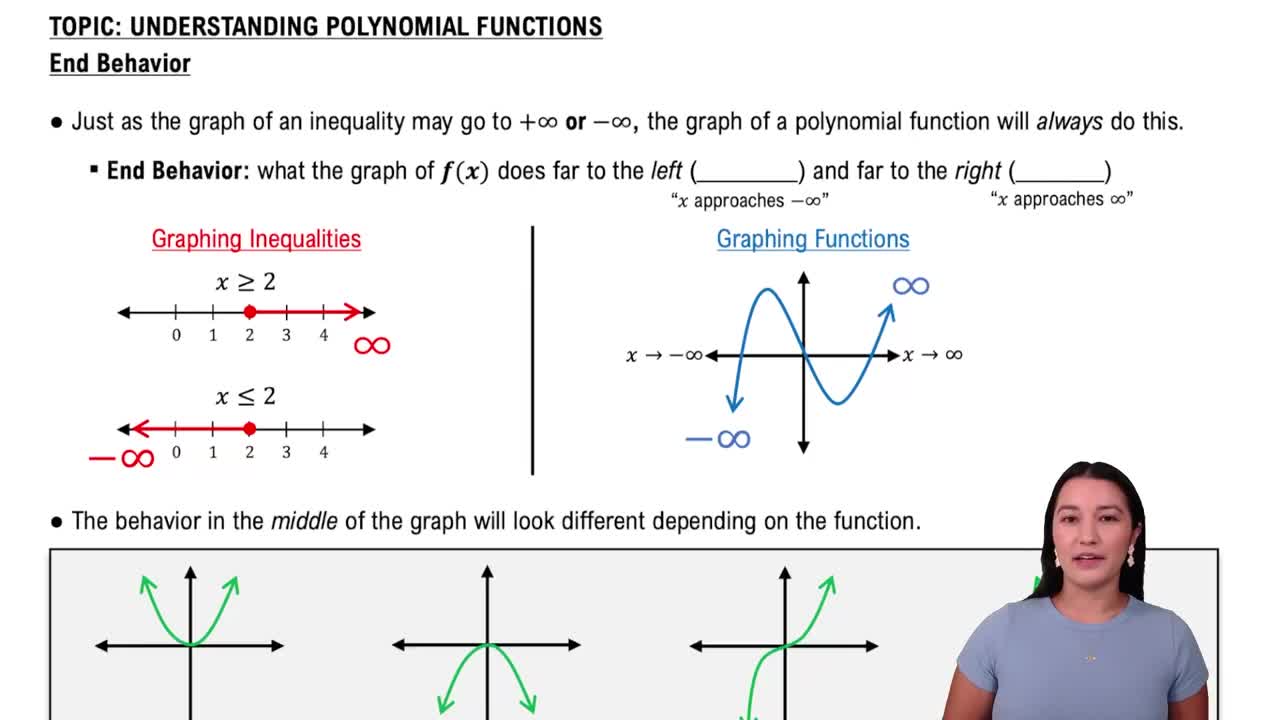
This video solution was recommended by our tutors as helpful for the problem above
Video duration:
3mPlay a video:
Was this helpful?
Key Concepts
Here are the essential concepts you must grasp in order to answer the question correctly.
End Behavior of Polynomial Functions
End behavior describes how the values of a polynomial function behave as x approaches positive or negative infinity. It is determined mainly by the leading term, which dominates the function for large absolute values of x. Understanding end behavior helps predict the general shape of the graph at its extremes.
Recommended video:
End Behavior of Polynomial Functions
Leading Term and Degree of a Polynomial
The leading term is the term with the highest power of x in a polynomial, and its degree is the exponent of that term. The degree and the sign of the leading coefficient dictate the end behavior of the polynomial. For example, an even degree with a positive leading coefficient means the graph rises on both ends.
Recommended video:
Guided course
Standard Form of Polynomials
End Behavior Diagrams
End behavior diagrams use arrows or symbols to visually represent how the graph behaves as x approaches infinity or negative infinity. These diagrams simplify understanding by showing whether the graph rises or falls on each end, based on the polynomial’s degree and leading coefficient.
Recommended video:
End Behavior of Polynomial Functions
Watch next
Master Introduction to Polynomial Functions with a bite sized video explanation from Patrick
Start learningRelated Videos
Related Practice
Textbook Question
1725
views
