Determine the intervals of the domain over which each function is continuous.
Table of contents
- 0. Review of Algebra4h 18m
- 1. Equations & Inequalities3h 18m
- 2. Graphs of Equations1h 43m
- 3. Functions2h 17m
- 4. Polynomial Functions1h 44m
- 5. Rational Functions1h 23m
- 6. Exponential & Logarithmic Functions2h 28m
- 7. Systems of Equations & Matrices4h 5m
- 8. Conic Sections2h 23m
- 9. Sequences, Series, & Induction1h 22m
- 10. Combinatorics & Probability1h 45m
2. Graphs of Equations
Graphs and Coordinates
Problem 25a
Textbook Question
Graph each equation in Exercises 13 - 28. Let x = - 3, - 2, - 1, 0, 1, 2, 3
y = 9 - x2
Verified step by step guidance
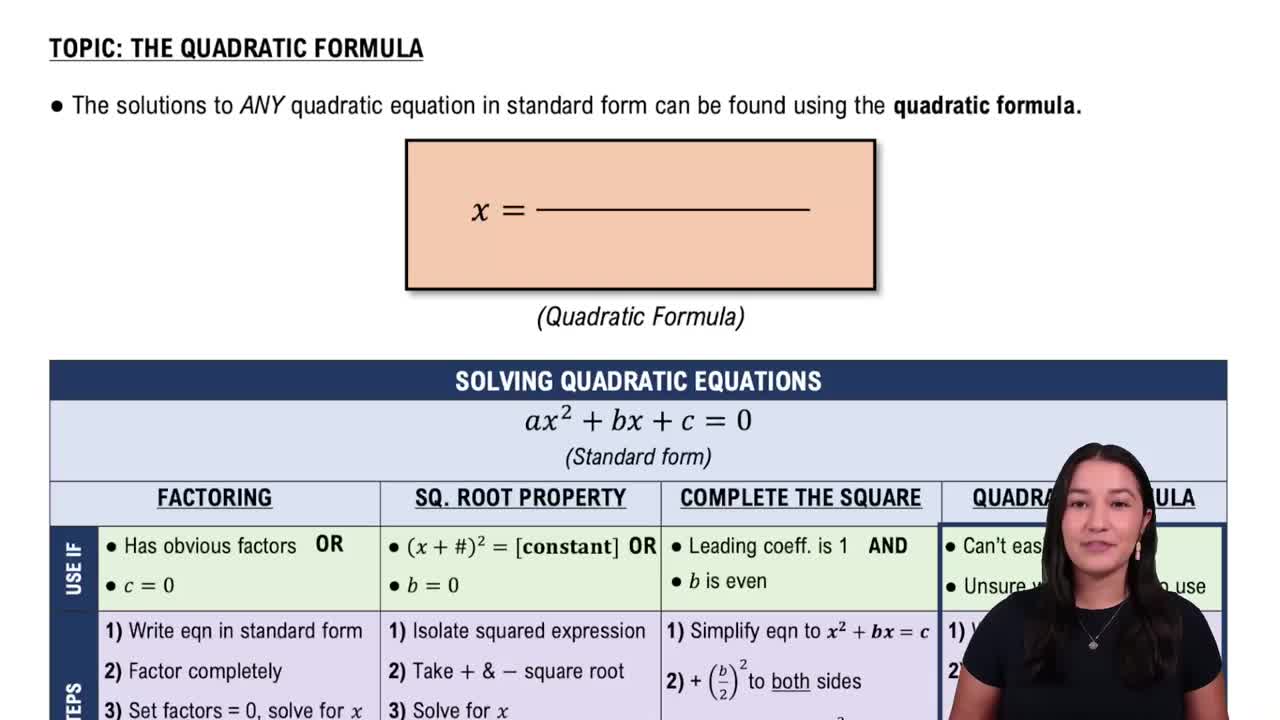
1
Step 1: Understand the equation. The given equation is y = 9 - x^2. This is a quadratic equation, and its graph will be a parabola. The term -x^2 indicates that the parabola opens downward because the coefficient of x^2 is negative.
Step 2: Create a table of values. Substitute the given x-values (-3, -2, -1, 0, 1, 2, 3) into the equation y = 9 - x^2 to calculate the corresponding y-values. For example, when x = -3, y = 9 - (-3)^2 = 9 - 9 = 0. Repeat this process for all x-values.
Step 3: Plot the points. Once you have the table of values, plot the points (x, y) on a coordinate plane. For example, if x = -3 gives y = 0, plot the point (-3, 0). Repeat for all other x-values.
Step 4: Draw the graph. After plotting all the points, connect them smoothly to form the parabola. Ensure the curve is symmetric about the y-axis, as the equation y = 9 - x^2 is symmetric with respect to the y-axis.
Step 5: Analyze the graph. The vertex of the parabola is at (0, 9), which is the maximum point since the parabola opens downward. The x-intercepts are the points where y = 0, and the y-intercept is the point where x = 0. Verify these features on your graph.
Verified video answer for a similar problem:This video solution was recommended by our tutors as helpful for the problem above
Video duration:
3mPlay a video:
Was this helpful?
Key Concepts
Here are the essential concepts you must grasp in order to answer the question correctly.
Quadratic Functions
A quadratic function is a polynomial function of degree two, typically expressed in the form y = ax^2 + bx + c. The graph of a quadratic function is a parabola, which can open upwards or downwards depending on the sign of 'a'. Understanding the shape and properties of parabolas is essential for graphing equations like y = 9 - x^2.
Recommended video:
Solving Quadratic Equations Using The Quadratic Formula
Vertex of a Parabola
The vertex of a parabola is the highest or lowest point on its graph, depending on its orientation. For the equation y = 9 - x^2, the vertex is at the point (0, 9), which is the maximum value of y. Identifying the vertex helps in sketching the graph accurately and understanding the function's behavior.
Recommended video:
Horizontal Parabolas
Graphing Points
Graphing points involves plotting specific values of x and their corresponding y values on a coordinate plane. In this case, substituting x values from -3 to 3 into the equation y = 9 - x^2 allows us to find the corresponding y values, which are then plotted to visualize the parabola. This process is crucial for accurately representing the function's graph.
Recommended video:
Guided course
Graphing Equations of Two Variables by Plotting Points
Watch next
Master Graphs & the Rectangular Coordinate System with a bite sized video explanation from Patrick
Start learningRelated Videos
Related Practice
Textbook Question
819
views
