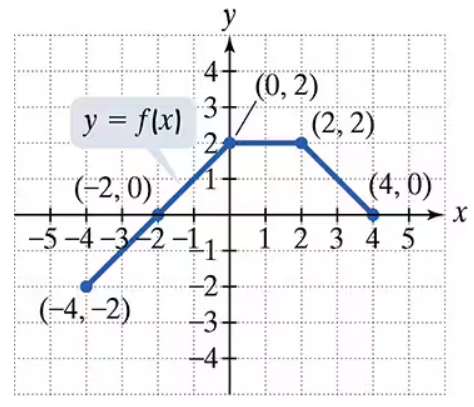
Use the graph of y = f(x) to graph each function g. g(x) = f(x+1)
Table of contents
- 0. Review of Algebra4h 18m
- 1. Equations & Inequalities3h 18m
- 2. Graphs of Equations1h 43m
- 3. Functions2h 17m
- 4. Polynomial Functions1h 44m
- 5. Rational Functions1h 23m
- 6. Exponential & Logarithmic Functions2h 28m
- 7. Systems of Equations & Matrices4h 5m
- 8. Conic Sections2h 23m
- 9. Sequences, Series, & Induction1h 22m
- 10. Combinatorics & Probability1h 45m
3. Functions
Common Functions
Problem 45
Textbook Question
Use the graph of y = f(x) to graph each function g. g(x) = f(x-1) – 1

Verified step by step guidance1
Understand the given problem: You are tasked with graphing the function g(x) = f(x-1) - 1 based on the graph of y = f(x). This involves applying transformations to the graph of f(x).
Identify the transformations: The term (x-1) inside the function indicates a horizontal shift to the right by 1 unit, and the term -1 outside the function indicates a vertical shift downward by 1 unit.
Apply the horizontal shift: Take each point (a, b) on the graph of y = f(x) and shift it to the right by 1 unit. This means the new x-coordinate will be a+1, while the y-coordinate remains b.
Apply the vertical shift: After applying the horizontal shift, take each new point and shift it downward by 1 unit. This means the new y-coordinate will be b-1, while the x-coordinate remains unchanged.
Plot the transformed points: Using the new coordinates obtained after both transformations, plot the points on the graph to create the graph of g(x). Ensure the shape of the graph remains consistent with the original graph of f(x).
Verified video answer for a similar problem:This video solution was recommended by our tutors as helpful for the problem above
Video duration:
3mPlay a video:
Was this helpful?
Key Concepts
Here are the essential concepts you must grasp in order to answer the question correctly.
Function Transformation
Function transformation refers to the changes made to the graph of a function based on modifications to its equation. In this case, g(x) = f(x-1) – 1 involves a horizontal shift to the right by 1 unit and a vertical shift downward by 1 unit. Understanding these transformations is crucial for accurately graphing the new function based on the original function f(x).
Recommended video:
Domain & Range of Transformed Functions
Horizontal Shift
A horizontal shift occurs when the input of a function is altered, affecting the graph's position along the x-axis. For g(x) = f(x-1), the 'x-1' indicates that the graph of f(x) is moved 1 unit to the right. This shift does not change the shape of the graph but repositions it, which is essential for correctly plotting g(x).
Recommended video:
Shifts of Functions
Vertical Shift
A vertical shift involves moving the graph of a function up or down along the y-axis. In the function g(x) = f(x-1) – 1, the '–1' indicates that the entire graph of f(x) is shifted down by 1 unit. This transformation is important for understanding how the output values of the function change relative to the original function.
Recommended video:
Shifts of Functions
Watch next
Master Graphs of Common Functions with a bite sized video explanation from Patrick
Start learningRelated Videos
Related Practice
Textbook Question
651
views
