Textbook Question
Graph each quadratic function. Give the (a) vertex, (b) axis, (c) domain, and (d) range. ƒ(x) = -(1/2)(x + 1)2 - 3
724
views
 Verified step by step guidanceVerified video answer for a similar problem:
 07:42
07:42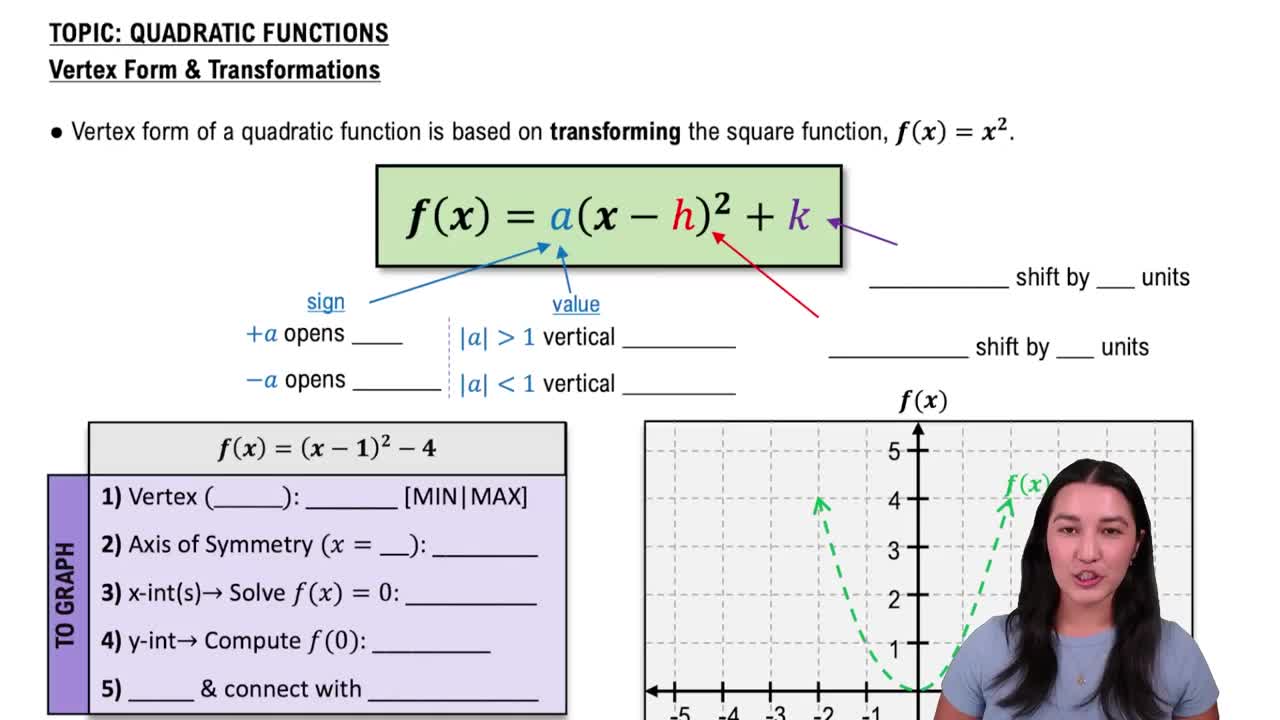 08:07
08:07 4:22
4:22 7:42m
7:42mMaster Properties of Parabolas with a bite sized video explanation from Patrick
Start learning