Textbook Question
Use the vertex and intercepts to sketch the graph of each quadratic function. Give the equation of the parabola's axis of symmetry. Use the graph to determine the function's domain and range. f(x)=2x−x2+3
705
views
 Verified step by step guidanceVerified video answer for a similar problem:
 5:26
5:26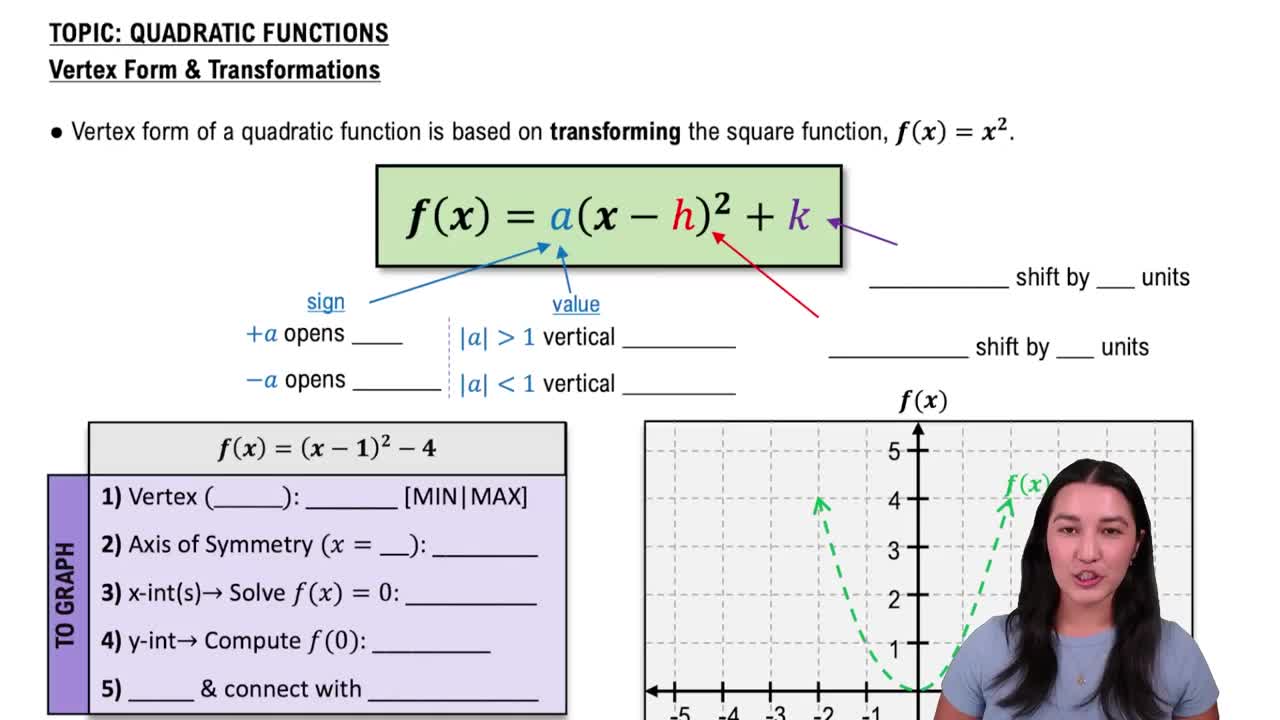 08:07
08:07 4:22
4:22 7:42m
7:42mMaster Properties of Parabolas with a bite sized video explanation from Patrick
Start learning