Join thousands of students who trust us to help them ace their exams!
Multiple Choice
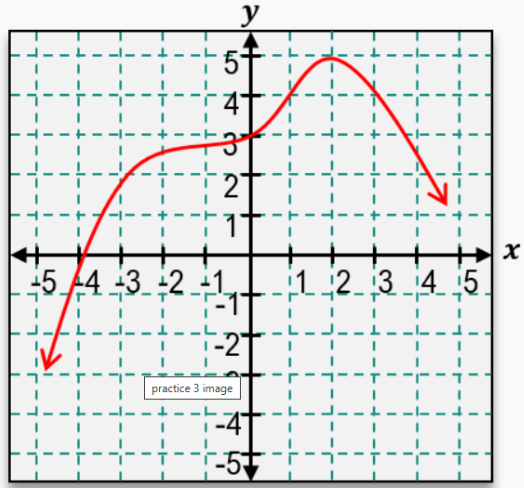
Given the graph of the following function, determine where the graph reaches a maximum.
A
B
C
D
0 Comments
Verified step by step guidance
1
Step 1: Identify the critical points on the graph where the slope of the function changes from positive to negative or vice versa. These points are potential maxima or minima and occur where the tangent to the curve is horizontal (slope = 0).
Step 2: Observe the graph and locate the points where the curve reaches a peak (highest point locally). These peaks represent local maxima.
Step 3: From the graph, note the x-values at these peaks. In this case, the graph has a peak around x = -2 and another around x = 2.
Step 4: Determine which of these peaks is a maximum by comparing the y-values (heights) of the peaks. The maximum is the peak with the highest y-value.
Step 5: Conclude that the graph reaches a maximum at the x-value corresponding to the highest peak, which from the graph appears to be at x = -2.


 Verified step by step guidance


