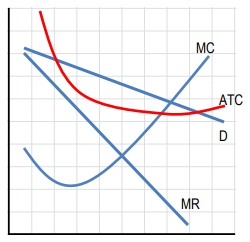
To determine the profit-maximizing quantity for a monopoly, the key principle is that this quantity occurs where marginal revenue (MR) equals marginal cost (MC). This concept is consistent across various market structures, including monopolistic competition. The intersection of the MR and MC curves on a graph indicates the optimal quantity to produce, which is crucial for maximizing profit or minimizing loss.
In a monopoly, the marginal revenue curve is distinct from the demand curve, which represents the price and average revenue. To find the profit-maximizing quantity, locate the point where the MR and MC curves intersect. From this intersection, drop down to the quantity axis to identify the specific quantity to produce.
Once the profit-maximizing quantity is established, calculating profit or loss involves comparing the price (derived from the demand curve) and the average total cost (ATC) at that quantity. The formula used is:
Profit = (Price - Average Total Cost) × Quantity
In a scenario where the average total cost is lower than the price, the area between the price and the average total cost on the graph represents profit. Conversely, if the average total cost exceeds the price, the area indicates a loss. This process mirrors the steps taken in perfect competition, although the curves and their relationships differ due to the nature of monopolistic pricing.
Understanding these concepts allows for effective analysis of monopolistic markets, where the ability to set prices above marginal cost can lead to significant profits or, in some cases, losses if costs are not managed effectively.