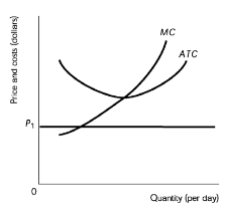
1
concept
Long Run Equilibrium
7m
Play a video:
Was this helpful?
Alright. So we've seen how that long run market supply stabilizes at the minimum 80 c price. Right? So I want to show you how even if a change in demand, right? If there's an increase in the demand for the product or a decrease in the demand, how it's still gonna stabilize at that minimum eight ec. Alright, so let's go ahead and walk through an example and show how we're always going to end up in the long run situation that that we've seen. All right, let's check it out. So, we're gonna see that shifts in the demand curve um are going to create a short run profit or a loss and that's gonna cause firms to enter and exit and then we're gonna end up back at the same equilibrium. Okay, so remember in the short run firms can earn economic profit, right? Let me go to run, firms can earn economic profit, right? But in the long run firms earn no economic profit. Right? So we've discussed that already. So, so let's start in our long run equilibrium, let's say we've reached our equilibrium and this is gonna be our starting point, right? So on the left, I have graphs of the whole market and on the right, we're gonna have graphs for an individual firm. Okay, so let's start here in our long run equilibrium and we've got some short sort of supply and demand that gets us to our equilibrium price right here and our equilibrium quantity, something like this, right? So that p one is our equilibrium price um that we found in the long run, right, And this black line right here, just like we discussed in the previous video, we had that flat long run supply curve um at the price, right? At that minimum 80 C. Price. And that's what we see on the right hand graph, if you look on the right hand graph for the individual firm at that price, we've got our minimum 80 C, right, we're gonna be producing right here where marginal cost crosses the marginal revenue curve, right? The price is equal to average revenue and equal to marginal revenue in perfect competition. Right? So at that price we're gonna produce this quantity and earn zero economic profit, right? Because price equals A. T. C. At that point, so there is no profit, right? This isn't really Q. Star, this is just the quantity that that firm is gonna produce. Okay, so that that's our long run equilibrium, that's just kind of our starting point right now, let's say there's some sort of change that increases demand. Say uh I don't know if this is week, we're talking about maybe everyone finds out that gluten free diets are hope and gluten is the best thing for you ever. And everyone wants gluten. Now, right, everyone wants gluten, I think that comes from wheat, I'm not an expert, but anyways there's some sort of change in the market that causes an increase in demand right? So now when we increase demand, we shift the demand curve to the right, Cool. So we had our original equilibrium right here, right where we were um at this this price, P. One and now demand has shifted to the right, okay, so now in the short run, what do we see? We found a new equilibrium up here. Right, let me use this color is black here, right? This is our new equilibrium, right? Where the new demand curve touches the supply curve. Cool. So what does that tell us we're gonna have this new quantity, right? There's gonna be some higher quantity from our previous equilibrium and a higher price. Right? P. Two up here. Some higher price because of this increase in demand. So what's gonna happen to the individual firm now that there's this higher price? So now the market is at P. Two and P two is now our um price which is our average revenue, which is also our marginal revenue, right? So that marginal revenue is touching our marginal cost curve right here, and that's where we're gonna produce. Right? So notice that our marginal cost curve and our average too total cost curve haven't changed from the graph above. Right? From this graph up here on the right, it's the same exact graph I copy and pasted save myself some time there. It's the same graph. Right? All that's changed, is this higher price because of the increased demand? And what do we see happening now? Now the price is greater than the average total cost, right? This little area right here. Well, that's gonna be our profit right, right in here, this is our profit. So now in the short run firms are making profit. And what did we say when firms are making profit in the short run? What's gonna happen other people are gonna get in the market, right, firms are going to enter the market because there's a short run profits. Alright, So let's go down to this last graph and let's see what happens when these firms start entering the market. So notice we had our increased demand, right? And our original supply right there, right? This was where we were and people were making profit right at this higher price p to the firms were making profit and other people are like, hey, there's money to be made, let's get into the market. So more firms start entering the market and it increases the supply, right? So the supply is gonna start increasing now, and what's gonna happen is firms are just gonna keep entering and keep entering until the profits are eliminated, right? So you can imagine this doesn't all happen in one fell swoop. It's not like we moved from S one to S. Two, Just in like one quick moment. But what's happening is firms are just gonna keep entering and keep entering and keep entering, right? We're gonna have all these supply ships to the right as firms keep entering the market until we find this equilibrium again. And guess what happens here at this equilibrium. Now, we're over here where the new demand curve touches the new supply curve, and we're back to p. one. Right now we're back to p. one. And all that's happened is we're supplying more quantity, right? Because there was some increased demand and more firms entered the market to satisfy that demand. And now we're back to our original situation for the firms, right? The firms are back over here at P. One at their minimum 80 C, producing that same quantity they were producing originally, right? There's just more firms in the market supplying to fulfill that bigger demand. Right? So there we, you know, we always end up back at this equilibrium where price equals minimum total cost, right, minimum, sorry, minimum average total cost, right minimum A. T. C. That is going to be our long run equilibrium. And you just saw how even changes in demand can lead us back to this same situation. Cool. Alright, let's go ahead and move on to the next video
2
Problem
If the price is P1, the firms are
A
Earning an economic profit and some firms will exit
B
Suffering an economic loss and some firms will exit
C
Earning an economic profit and some firms will enter
D
Suffering an economic loss and some firms will enter
3
Problem
Suppose the cost curves apply to all firms in the industry. If the initial price is P1, in the long run, the market
A
Supply will decrease
B
Demand will decrease
C
Supply will increase
D
Demand will increase
4
Problem
A new study shows that eating raw garlic keeps vampires away (vampires have become a huge problem). This news shifts the demand curve for raw garlic to the right. In response, new firms enter the garlic market. While firms are entering the market, the price of raw garlic ____________ and the profit of each existing firm _____________.
A
Falls; rises
B
Rises; falls
C
Rises; rises
D
Falls; falls