Table of contents
- 1. Intro to Stats and Collecting Data(0)
- 2. Describing Data with Tables and Graphs(0)
- 3. Describing Data Numerically(0)
- 4. Probability(0)
- 5. Binomial Distribution & Discrete Random Variables(0)
- 6. Normal Distribution and Continuous Random Variables(0)
- 7. Sampling Distributions & Confidence Intervals: Mean(0)
- 8. Sampling Distributions & Confidence Intervals: Proportion(0)
- 9. Hypothesis Testing for One Sample(0)
- 10. Hypothesis Testing for Two Samples(0)
- 11. Correlation(0)
- 12. Regression(0)
- 13. Chi-Square Tests & Goodness of Fit(0)
- 14. ANOVA(0)
1. Intro to Stats and Collecting Data
Intro to Stats
1. Intro to Stats and Collecting Data
Intro to Stats: Videos & Practice Problems
139 of 0
Problem 139Multiple Choice
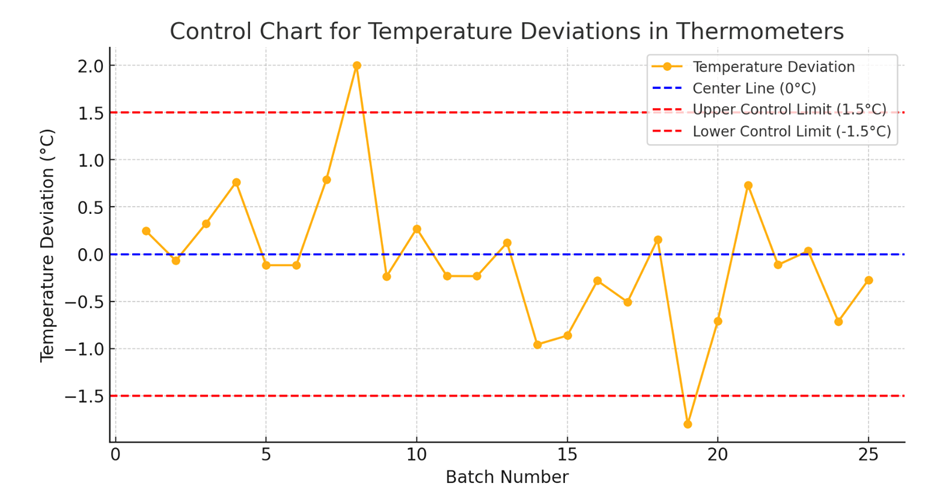
Use the following control chart, which results from the temperature deviation data for 25 consecutive batches, each containing 40 newly manufactured thermometers.
The thermometers must meet strict accuracy standards. The recorded values represent temperature deviations (in °C) from a calibrated reference under controlled conditions. Industry regulations require that deviations remain within ±1.5 °C.

Is the process within statistical control? Why or why not?
0 Comments