Table of contents
- 1. Intro to Stats and Collecting Data(0)
- 2. Describing Data with Tables and Graphs(0)
- 3. Describing Data Numerically(0)
- 4. Probability(0)
- 5. Binomial Distribution & Discrete Random Variables(0)
- 6. Normal Distribution and Continuous Random Variables(0)
- 7. Sampling Distributions & Confidence Intervals: Mean(0)
- 8. Sampling Distributions & Confidence Intervals: Proportion(0)
- 9. Hypothesis Testing for One Sample(0)
- 10. Hypothesis Testing for Two Samples(0)
- 11. Correlation(0)
- 12. Regression(0)
- 13. Chi-Square Tests & Goodness of Fit(0)
- 14. ANOVA(0)
2. Describing Data with Tables and Graphs
Frequency Distributions
2. Describing Data with Tables and Graphs
Frequency Distributions: Videos & Practice Problems
20 of 0
Problem 20Multiple Choice
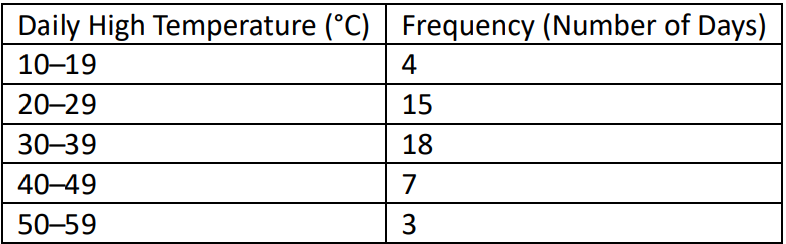
A study records the daily high temperatures (in °C) in a city over multiple years. The following frequency distribution table shows the number of days falling within specific temperature ranges. What is the class width? Is it possible to determine the original temperature data?

0 Comments