Table of contents
- 1. Intro to Stats and Collecting Data(0)
- 2. Describing Data with Tables and Graphs(0)
- 3. Describing Data Numerically(0)
- 4. Probability(0)
- 5. Binomial Distribution & Discrete Random Variables(0)
- 6. Normal Distribution and Continuous Random Variables(0)
- 7. Sampling Distributions & Confidence Intervals: Mean(0)
- 8. Sampling Distributions & Confidence Intervals: Proportion(0)
- 9. Hypothesis Testing for One Sample(0)
- 10. Hypothesis Testing for Two Samples(0)
- 11. Correlation(0)
- 12. Regression(0)
- 13. Chi-Square Tests & Goodness of Fit(0)
- 14. ANOVA(0)
3. Describing Data Numerically
Standard Deviation
3. Describing Data Numerically
Standard Deviation: Videos & Practice Problems
23 of 0
Problem 23Multiple Choice
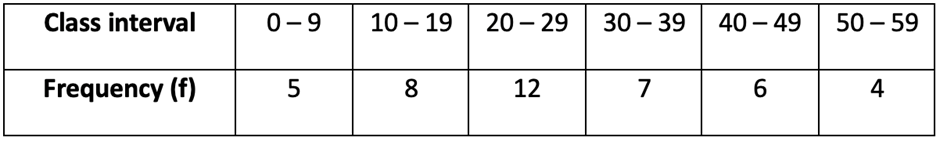
Using the frequency distribution provided below, calculate the standard deviation using the formula, where x denotes the class midpoint, f is the class frequency, and n represents the total number of sample values.

Then, compare your calculated standard deviation with the value of 14.90 obtained using the sum of squares of deviations formula.
0 Comments