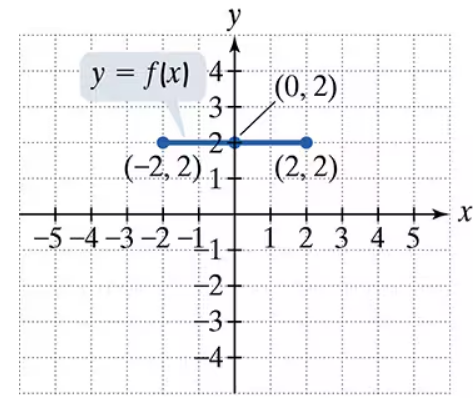
Use the graph of y = f(x) to graph each function g. g(x) = f(x+1)
Verified step by step guidance
1
Understand that the function g(x) = f(x + 1) represents a horizontal shift of the original function f(x). Specifically, the graph of f(x) is shifted to the left by 1 unit because the input x is replaced by (x + 1).
Identify key points on the original graph y = f(x). For example, note the coordinates of points where the function changes direction or has important features (like endpoints or peaks).
For each key point (x, y) on the graph of f(x), find the corresponding point on g(x) by subtracting 1 from the x-coordinate. This means the new point will be at (x - 1, y).
Plot these new points on the coordinate plane. Since the function is shifted left, all points move one unit to the left compared to their original positions on f(x).
Connect the new points smoothly, maintaining the shape of the original graph, to complete the graph of g(x) = f(x + 1).
Verified video answer for a similar problem:
This video solution was recommended by our tutors as helpful for the problem above
Video duration:
2m
Play a video:
Was this helpful?
Key Concepts
Here are the essential concepts you must grasp in order to answer the question correctly.
Function Transformation
Function transformation involves changing the graph of a function by shifting, stretching, compressing, or reflecting it. In this problem, the transformation is a horizontal shift, which moves the graph left or right without altering its shape.
A horizontal shift occurs when the input variable x in the function is replaced by (x + c) or (x - c). For g(x) = f(x + 1), the graph of f(x) shifts 1 unit to the left because adding inside the function moves the graph in the opposite direction of the sign.
Interpreting graphs requires understanding how points and shapes move under transformations. The image shows the original function f(x) and the shifted function g(x), illustrating how each point on f(x) moves horizontally to create g(x).
 Verified step by step guidance
 4:22
4:22

