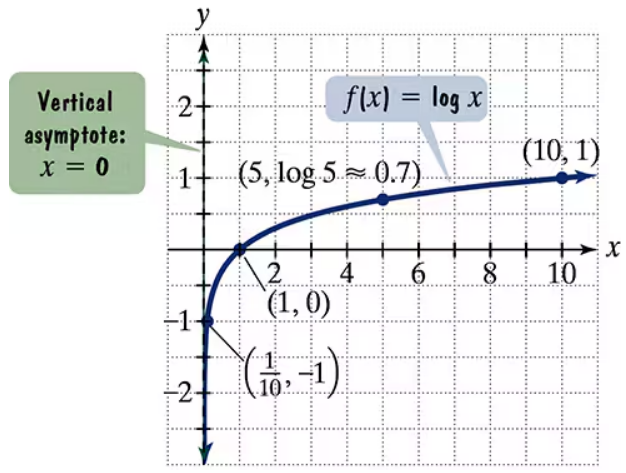
Graph each function. Give the domain and range. ƒ(x) = (log2 x) + 3
Table of contents
- 0. Review of Algebra4h 18m
- 1. Equations & Inequalities3h 18m
- 2. Graphs of Equations1h 43m
- 3. Functions2h 17m
- 4. Polynomial Functions1h 44m
- 5. Rational Functions1h 23m
- 6. Exponential & Logarithmic Functions2h 28m
- 7. Systems of Equations & Matrices4h 5m
- 8. Conic Sections2h 23m
- 9. Sequences, Series, & Induction1h 22m
- 10. Combinatorics & Probability1h 45m
6. Exponential & Logarithmic Functions
Introduction to Logarithms
Problem 63
Textbook Question
The figure shows the graph of f(x) = log x. In Exercises 59–64, use transformations of this graph to graph each function. Graph and give equations of the asymptotes. Use the graphs to determine each function's domain and range.

g(x) = 1-log x
Verified step by step guidance1
Start with the graph of f(x) = \log x, which has a vertical asymptote at x = 0.
The function g(x) = 1 - \log x is a vertical reflection of f(x) = \log x across the x-axis, followed by a vertical shift upwards by 1 unit.
Reflect the graph of f(x) = \log x across the x-axis to get -\log x.
Shift the graph of -\log x upwards by 1 unit to obtain g(x) = 1 - \log x.
The domain of g(x) is (0, \infty) and the range is (-\infty, 1). The vertical asymptote remains at x = 0.
Verified video answer for a similar problem:This video solution was recommended by our tutors as helpful for the problem above
Video duration:
6mPlay a video:
Was this helpful?
Key Concepts
Here are the essential concepts you must grasp in order to answer the question correctly.
Logarithmic Function and Its Graph
The logarithmic function f(x) = log x is the inverse of the exponential function and is defined only for positive x-values. Its graph passes through (1,0) and has a vertical asymptote at x = 0. Understanding this base graph is essential for analyzing transformations and domain restrictions.
Recommended video:
Graphs of Logarithmic Functions
Transformations of Functions
Transformations include shifts, reflections, and stretches of the base graph. For g(x) = 1 - log x, the graph is reflected vertically (due to the negative sign) and shifted upward by 1 unit. Recognizing these changes helps in sketching the new graph and determining its properties.
Recommended video:
Domain & Range of Transformed Functions
Asymptotes, Domain, and Range
The vertical asymptote of log functions remains at x = 0 despite transformations. The domain is the set of x-values where the function is defined (x > 0), and the range depends on vertical shifts and reflections. Identifying asymptotes and domain/range is crucial for graphing and understanding function behavior.
Recommended video:
Determining Horizontal Asymptotes
Watch next
Master Logarithms Introduction with a bite sized video explanation from Patrick
Start learningRelated Videos
Related Practice
Textbook Question
641
views
