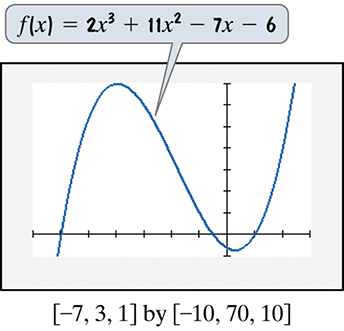
In Exercises 71–72, use the graph of the polynomial function to solve each inequality.
2x^3 + 11x^2 ≥ 7x + 6
Verified step by step guidance
1
Rewrite the given inequality \$2x^3 + 11x^2 \geq 7x + 6\( by bringing all terms to one side to set the inequality to zero: \)2x^3 + 11x^2 - 7x - 6 \geq 0$.
Recognize that the expression on the left side is the polynomial function \(f(x) = 2x^3 + 11x^2 - 7x - 6\) whose graph is provided.
Identify the x-values where \(f(x) = 0\) by looking at the points where the graph crosses the x-axis. These are the roots of the polynomial and critical points for the inequality.
Determine the intervals on the x-axis where the graph of \(f(x)\) is above or on the x-axis (i.e., where \(f(x) \geq 0\)). These intervals satisfy the inequality.
Express the solution set as the union of intervals where \(f(x) \geq 0\), based on the x-intercepts and the behavior of the graph between these points.
Verified video answer for a similar problem:
This video solution was recommended by our tutors as helpful for the problem above
Video duration:
4m
Play a video:
Was this helpful?
Key Concepts
Here are the essential concepts you must grasp in order to answer the question correctly.
Polynomial Functions and Their Graphs
A polynomial function is an expression involving variables raised to whole-number exponents and their coefficients. The graph of a polynomial function shows its behavior, including where it crosses the x-axis (roots) and its general shape. Understanding the graph helps in visualizing solutions to inequalities involving the polynomial.
To solve inequalities like f(x) ≥ 0 using a graph, identify where the graph lies above or on the x-axis. The x-values corresponding to these regions satisfy the inequality. The points where the graph touches or crosses the x-axis are critical points that divide the number line into intervals to test.
Roots or zeros of a polynomial are the x-values where the function equals zero, i.e., where the graph crosses the x-axis. These roots are essential for solving inequalities because they mark boundaries between positive and negative values of the function. They can be found algebraically or estimated from the graph.

 Verified step by step guidance
 05:25
05:25