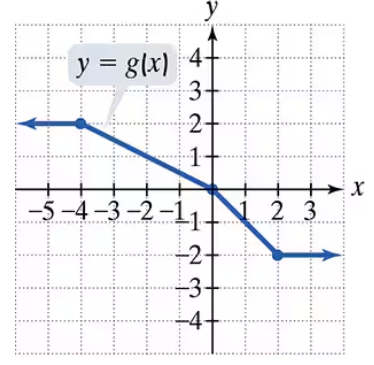
In Exercises 55–64, use the vertical line test to identify graphs in which y is a function of x.
Table of contents
- 0. Review of Algebra4h 18m
- 1. Equations & Inequalities3h 18m
- 2. Graphs of Equations1h 43m
- 3. Functions2h 17m
- 4. Polynomial Functions1h 44m
- 5. Rational Functions1h 23m
- 6. Exponential & Logarithmic Functions2h 28m
- 7. Systems of Equations & Matrices4h 5m
- 8. Conic Sections2h 23m
- 9. Sequences, Series, & Induction1h 22m
- 10. Combinatorics & Probability1h 45m
2. Graphs of Equations
Graphs and Coordinates
Problem 75
Textbook Question
Use the graph of g to solve Exercises 71–76.

For what value of x is g(x) = 1?
Verified step by step guidance1
Step 1: Understand the problem. We are tasked with finding the value of x for which g(x) = 1. This means we need to locate the points on the graph where the y-coordinate (output of the function g) is equal to 1.
Step 2: Analyze the graph. Look for the horizontal line y = 1 on the graph and identify where the red curve intersects this line. These intersection points correspond to the x-values where g(x) = 1.
Step 3: Observe the graph carefully. The red curve intersects the horizontal line y = 1 at two points. Note the x-coordinates of these intersection points.
Step 4: Verify the x-values. Ensure that at these x-values, the corresponding y-value on the graph is indeed 1. This confirms the solution.
Step 5: Write down the x-values. These are the solutions to the equation g(x) = 1 based on the graph provided.
Verified video answer for a similar problem:This video solution was recommended by our tutors as helpful for the problem above
Video duration:
1mPlay a video:
Was this helpful?
Key Concepts
Here are the essential concepts you must grasp in order to answer the question correctly.
Function and Graph Interpretation
Understanding functions involves recognizing how inputs (x-values) relate to outputs (y-values). A graph visually represents this relationship, allowing us to identify specific values, such as where a function equals a certain number. In this case, we need to find the x-value where g(x) equals 1 by analyzing the graph.
Recommended video:
Graphs of Logarithmic Functions
Finding Intersections
To determine where g(x) equals a specific value, we look for intersections between the graph of the function and a horizontal line representing that value. For g(x) = 1, we would draw a horizontal line at y = 1 and observe where it intersects the graph, indicating the corresponding x-value.
Recommended video:
Finding the Domain of an Equation
Coordinate System
The coordinate system consists of an x-axis (horizontal) and a y-axis (vertical), which together form a grid for plotting points. Each point on the graph is defined by an ordered pair (x, y). Understanding this system is crucial for accurately locating points on the graph and interpreting their significance in relation to the function.
Recommended video:
Guided course
Graphs & the Rectangular Coordinate System
Watch next
Master Graphs & the Rectangular Coordinate System with a bite sized video explanation from Patrick
Start learningRelated Videos
Related Practice
Textbook Question
37
views
