In Exercises 6–8, use the graph and determine the x-intercepts if any, and the y-intercepts if any. For each graph, tick marks along the axes represent one unit each.
Table of contents
- 0. Review of Algebra4h 18m
- 1. Equations & Inequalities3h 18m
- 2. Graphs of Equations1h 43m
- 3. Functions2h 17m
- 4. Polynomial Functions1h 44m
- 5. Rational Functions1h 23m
- 6. Exponential & Logarithmic Functions2h 28m
- 7. Systems of Equations & Matrices4h 5m
- 8. Conic Sections2h 23m
- 9. Sequences, Series, & Induction1h 22m
- 10. Combinatorics & Probability1h 45m
2. Graphs of Equations
Graphs and Coordinates
Problem 13a
Textbook Question
Graph each equation in Exercises 13 - 28. Let x = - 3, - 2, - 1, 0, 1, 2, 3
y = x2 - 2
Verified step by step guidance
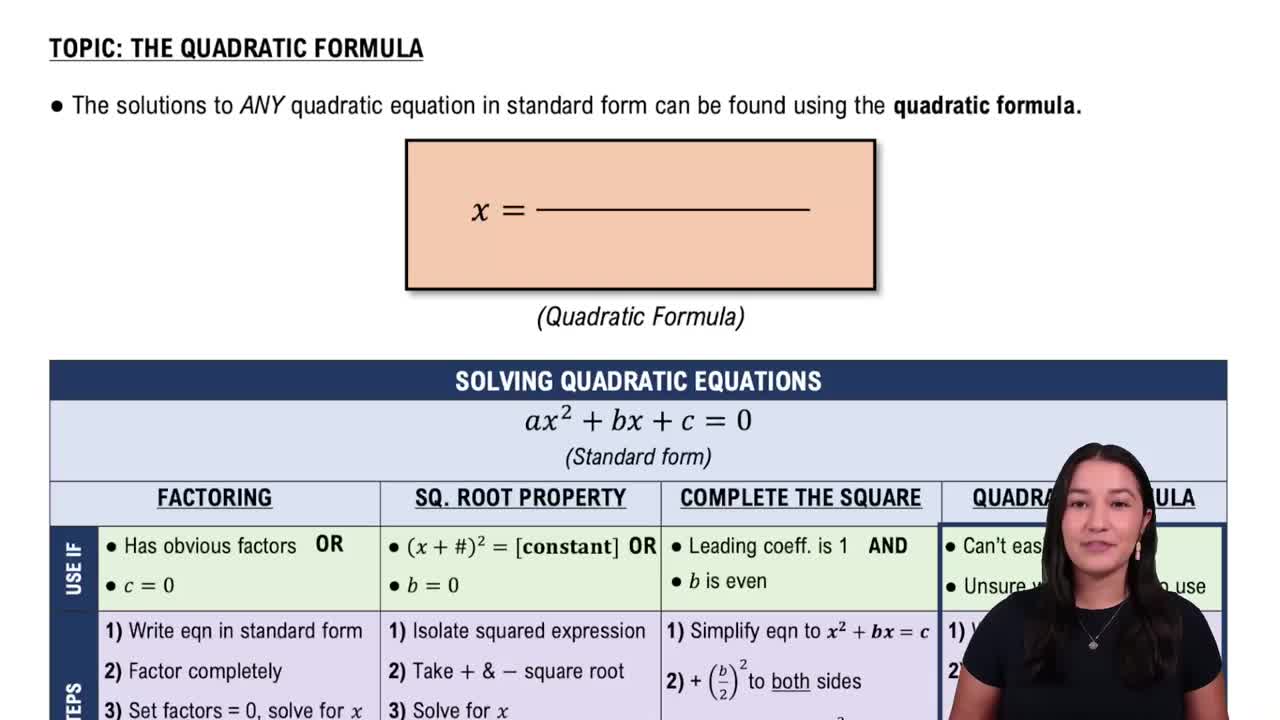
1
Step 1: Understand the equation. The given equation is y = x^2 - 2. This is a quadratic equation, which represents a parabola that opens upwards because the coefficient of x^2 is positive.
Step 2: Create a table of values. Substitute the given x-values (-3, -2, -1, 0, 1, 2, 3) into the equation y = x^2 - 2 to calculate the corresponding y-values. For example, when x = -3, y = (-3)^2 - 2 = 9 - 2 = 7.
Step 3: Plot the points. Use the x-values and their corresponding y-values to create ordered pairs (x, y). For example, one point is (-3, 7). Repeat this for all x-values to get the full set of points.
Step 4: Draw the graph. Plot the points from the table on a coordinate plane. Since the equation is quadratic, the points will form a parabolic shape. Connect the points smoothly to complete the graph.
Step 5: Analyze the graph. The vertex of the parabola is at the lowest point (minimum) because the parabola opens upwards. The axis of symmetry is the vertical line x = 0, and the y-intercept is the point where the graph crosses the y-axis (x = 0, y = -2).
Verified video answer for a similar problem:This video solution was recommended by our tutors as helpful for the problem above
Video duration:
3mPlay a video:
Was this helpful?
Key Concepts
Here are the essential concepts you must grasp in order to answer the question correctly.
Quadratic Functions
A quadratic function is a polynomial function of degree two, typically expressed in the form y = ax^2 + bx + c. The graph of a quadratic function is a parabola, which can open upwards or downwards depending on the sign of the coefficient 'a'. Understanding the shape and properties of parabolas is essential for graphing quadratic equations.
Recommended video:
Solving Quadratic Equations Using The Quadratic Formula
Vertex of a Parabola
The vertex of a parabola is the highest or lowest point on the graph, depending on its orientation. For the function y = x^2 - 2, the vertex can be found at the point (0, -2), which is derived from the standard form of the quadratic equation. The vertex plays a crucial role in determining the graph's symmetry and direction.
Recommended video:
Horizontal Parabolas
Graphing Points
Graphing points involves plotting specific values of x and their corresponding y values on a coordinate plane. In this case, substituting x values from -3 to 3 into the equation y = x^2 - 2 allows us to find the corresponding y values, which can then be plotted to visualize the quadratic function. This process is fundamental for accurately representing the function's behavior.
Recommended video:
Guided course
Graphing Equations of Two Variables by Plotting Points
Watch next
Master Graphs & the Rectangular Coordinate System with a bite sized video explanation from Patrick
Start learningRelated Videos
Related Practice
Textbook Question
1050
views
