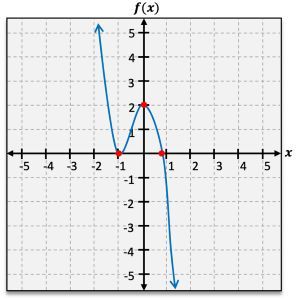
Understanding the behavior of polynomial functions involves identifying key points such as end behavior, x-intercepts, y-intercepts, and turning points. However, to create a complete graph, it is essential to explore the intervals between these known points to uncover the function's behavior in those regions.
To achieve this, we can break the graph into intervals defined by the known points. For instance, if we have a known point at \( x = -2 \), we can analyze the interval from negative infinity to \( -2 \). In this interval, we need to select a point, such as \( x = -3 \), and calculate \( f(-3) \) to obtain an ordered pair that can be plotted on the graph.
Continuing this process, we examine the next interval from \( -2 \) to \( 0 \). A suitable choice here could be \( x = -1 \). By calculating \( f(-1) \), we gain another point to plot. Moving to the interval from \( 0 \) to \( 3 \), we might select \( x = 2 \) and compute \( f(2) \) for additional information. Finally, in the interval from \( 3 \) to infinity, choosing \( x = 4 \) allows us to calculate \( f(4) \) and plot yet another point.
After plotting these points, we can connect them to visualize the complete graph of the polynomial function. This method not only fills in the gaps between known points but also provides a clearer understanding of the function's overall behavior. If desired, additional points can be calculated to refine the graph further, ensuring a comprehensive representation of the polynomial function.


