Table of contents
- 1. Intro to Stats and Collecting Data(0)
- 2. Describing Data with Tables and Graphs(0)
- 3. Describing Data Numerically(0)
- 4. Probability(0)
- 5. Binomial Distribution & Discrete Random Variables(0)
- 6. Normal Distribution and Continuous Random Variables(0)
- 7. Sampling Distributions & Confidence Intervals: Mean(0)
- 8. Sampling Distributions & Confidence Intervals: Proportion(0)
- 9. Hypothesis Testing for One Sample(0)
- 10. Hypothesis Testing for Two Samples(0)
- 11. Correlation(0)
- 12. Regression(0)
- 13. Chi-Square Tests & Goodness of Fit(0)
- 14. ANOVA(0)
3. Describing Data Numerically
Standard Deviation
3. Describing Data Numerically
Standard Deviation: Videos & Practice Problems

72 of 0
Problem 72Multiple Choice
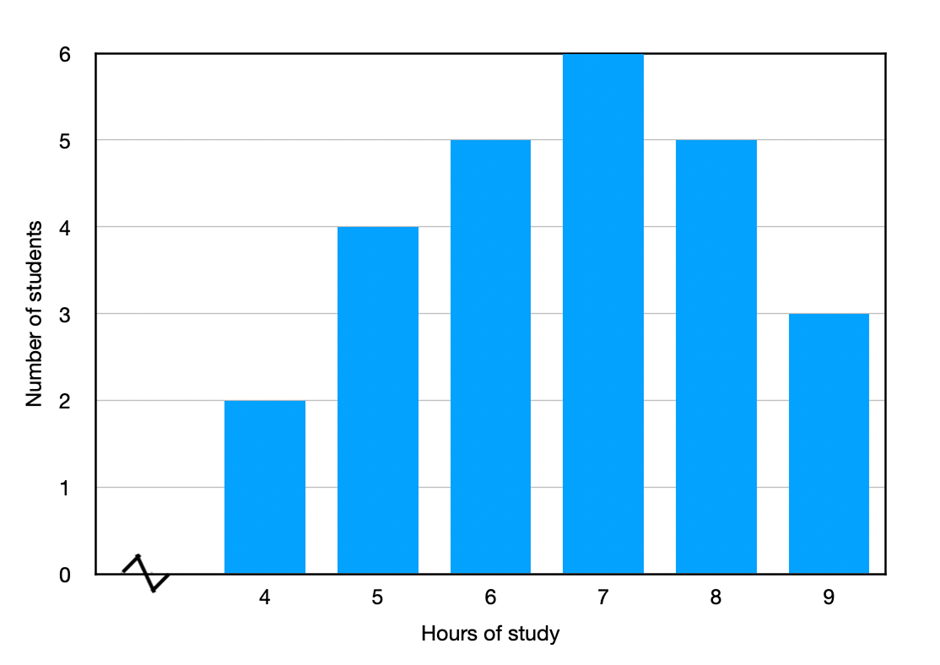
Use the graph below to estimate the sample standard deviation and calculate the actual standard deviation using individual data values. Compare both results and select the appropriate option from below.
0 Comments