Table of contents
- 1. Intro to Stats and Collecting Data(0)
- 2. Describing Data with Tables and Graphs(0)
- 3. Describing Data Numerically(0)
- 4. Probability(0)
- 5. Binomial Distribution & Discrete Random Variables(0)
- 6. Normal Distribution and Continuous Random Variables(0)
- 7. Sampling Distributions & Confidence Intervals: Mean(0)
- 8. Sampling Distributions & Confidence Intervals: Proportion(0)
- 9. Hypothesis Testing for One Sample(0)
- 10. Hypothesis Testing for Two Samples(0)
- 11. Correlation(0)
- 12. Regression(0)
- 13. Chi-Square Tests & Goodness of Fit(0)
- 14. ANOVA(0)
3. Describing Data Numerically
Standard Deviation
3. Describing Data Numerically
Standard Deviation: Videos & Practice Problems

66 of 0
Problem 66Multiple Choice
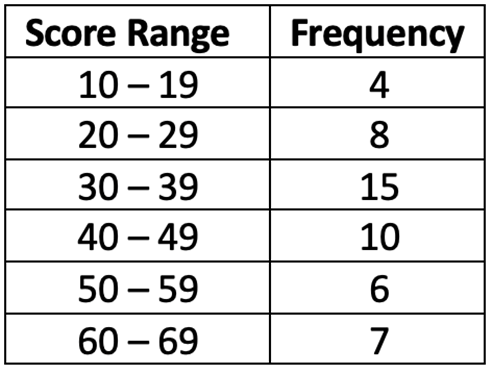
Using the frequency distribution, estimate the data's sample mean and sample standard deviation.
Are the mean and standard deviation calculated from grouped data as precise as those from ungrouped (individual) data? Explain.
0 Comments