Identify the base of the logarithm and the argument inside the function. Here, the function is given as \(f(x) = \log_{\frac{1}{2}}(x+3) - 2\), where the base is \(\frac{1}{2}\) and the argument is \((x+3)\).
Determine the domain of the function by setting the argument greater than zero: \(x + 3 > 0\). Solve this inequality to find the domain of \(f(x)\).
Find the vertical asymptote by setting the argument equal to zero: \(x + 3 = 0\). This vertical line will be an asymptote of the graph.
Understand the effect of the base \(\frac{1}{2}\) on the graph. Since the base is between 0 and 1, the logarithmic function is decreasing. Also, the \(-2\) outside the logarithm shifts the graph down by 2 units.
Plot key points such as when the argument equals 1 (i.e., \(x + 3 = 1\)) to find \(f(x)\) at that point, and use the vertical asymptote and the general shape of a decreasing logarithmic function to sketch the graph.
Verified video answer for a similar problem:
This video solution was recommended by our tutors as helpful for the problem above
Video duration:
3m
Play a video:
0 Comments
Key Concepts
Here are the essential concepts you must grasp in order to answer the question correctly.
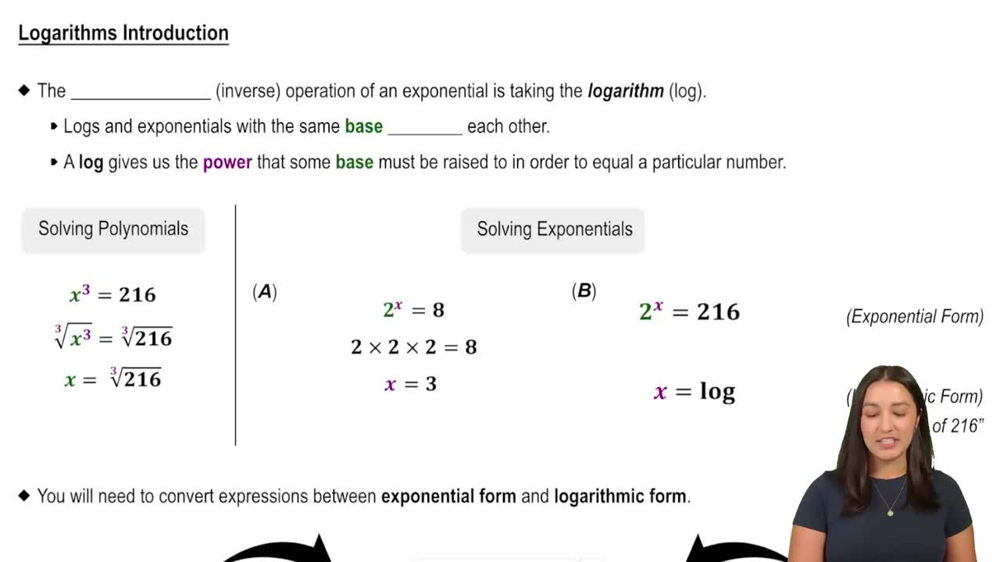
Logarithmic Functions
A logarithmic function is the inverse of an exponential function and is written as f(x) = log_b(x), where b is the base. It answers the question: to what power must the base be raised to produce x? Understanding the properties of logarithms is essential for graphing and interpreting these functions.
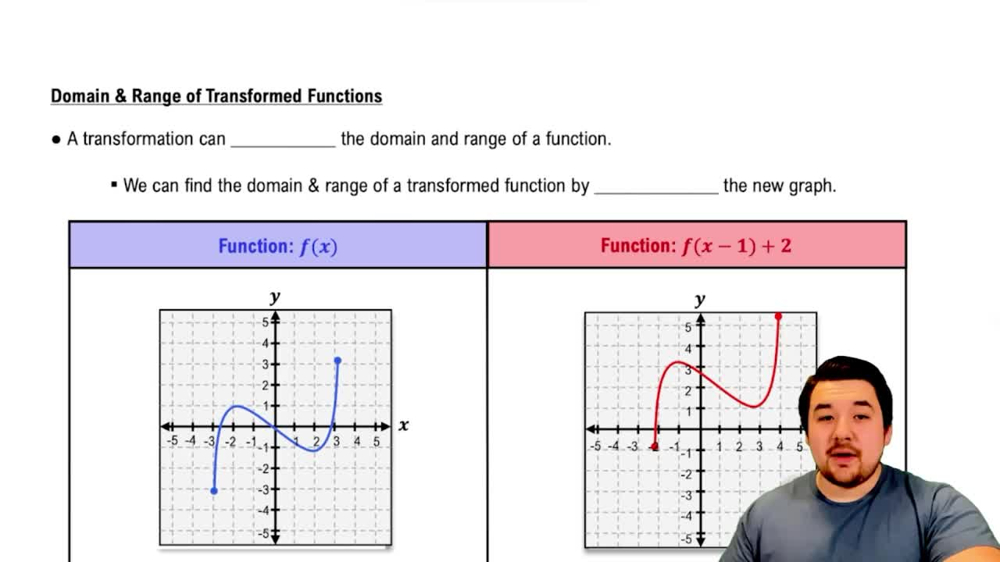
Function transformations include shifts, stretches, and reflections that alter the graph's position or shape. For f(x) = log_{1/2}(x+3) - 2, the '+3' inside the log shifts the graph horizontally left by 3 units, and the '-2' shifts it vertically down by 2 units. Recognizing these helps in accurately sketching the graph.
When the base of a logarithm is between 0 and 1, such as 1/2, the function is decreasing rather than increasing. This means the graph slopes downward as x increases, which is the opposite behavior compared to bases greater than 1. This affects the shape and direction of the graph.

 Verified step by step guidance
 5:26
5:26