Table of contents
- 1. Intro to Stats and Collecting Data(0)
- 2. Describing Data with Tables and Graphs(0)
- 3. Describing Data Numerically(0)
- 4. Probability(0)
- 5. Binomial Distribution & Discrete Random Variables(0)
- 6. Normal Distribution and Continuous Random Variables(0)
- 7. Sampling Distributions & Confidence Intervals: Mean(0)
- 8. Sampling Distributions & Confidence Intervals: Proportion(0)
- 9. Hypothesis Testing for One Sample(0)
- 10. Hypothesis Testing for Two Samples(0)
- 11. Correlation(0)
- 12. Regression(0)
- 13. Chi-Square Tests & Goodness of Fit(0)
- 14. ANOVA(0)
13. Chi-Square Tests & Goodness of Fit
Goodness of Fit Test
13. Chi-Square Tests & Goodness of Fit
Goodness of Fit Test: Videos & Practice Problems
50 of 0
Problem 50Multiple Choice
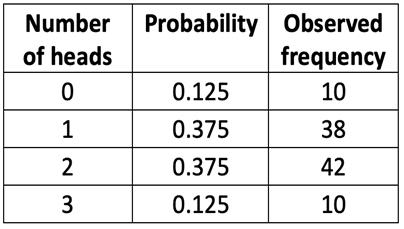
A common experiment in probability involves flipping a coin. If a coin is fair, we would expect a specific distribution of heads (H) or tails (T) in a series of flips. Suppose we flip a coin three times. The expected probability distribution for the number of heads obtained (if the coin is fair and each flip is independent) is shown in the first two columns of the following table. The third column represents the actual observed frequency of heads from sets of coin flips.

Do these data support the distribution that would exist if the coin is fair and the outcome of each flip is independent? Use the level of significance.
0 Comments