Understanding the sine and cosine functions is essential for graphing these trigonometric functions on a standard x-y graph. The sine function corresponds to the y-coordinates on the unit circle, while the cosine function relates to the x-coordinates. As you traverse the unit circle, the values of sine and cosine repeat, leading to a wave-like pattern in their graphs.
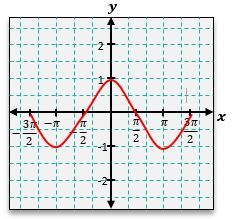
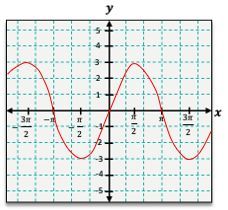
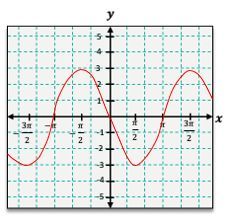
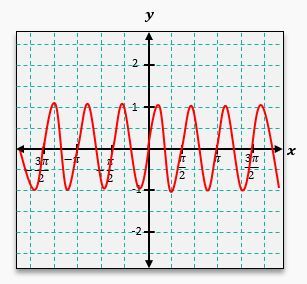
To graph the sine function, y = \(\sin\)(x), you can start by plotting key points based on the unit circle. For example, at x = 0, y = \(\sin\)(0) = 0; at x = \(\frac{\pi}{2}\), y = \(\sin\[\left\)(\(\frac{\pi}{2}\]\right\)) = 1; at x = \(\pi\), y = \(\sin\)(\(\pi\)) = 0; and at x = \(\frac{3\pi}{2}\), y = \(\sin\[\left\)(\(\frac{3\pi}{2}\]\right\)) = -1. Continuing this process reveals that the sine graph oscillates between -1 and 1, creating a smooth wave pattern.
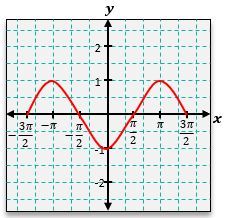
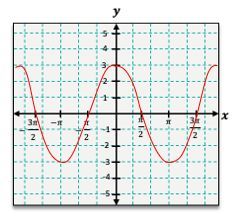
Similarly, the cosine function, y = \(\cos\)(x), can be graphed using its corresponding points. At x = 0, y = \(\cos\)(0) = 1; at x = \(\frac{\pi}{2}\), y = \(\cos\[\left\)(\(\frac{\pi}{2}\]\right\)) = 0; at x = \(\pi\), y = \(\cos\)(\(\pi\)) = -1; and at x = \(\frac{3\pi}{2}\), y = \(\cos\[\left\)(\(\frac{3\pi}{2}\]\right\)) = 0. The cosine graph also exhibits a wave pattern, but it starts at a maximum value of 1, contrasting with the sine graph that begins at 0.
In wave terminology, the highest points of the graph are referred to as crests or peaks, while the lowest points are known as troughs or valleys. These peaks and valleys can vary in height depending on transformations applied to the sine and cosine functions.
One common transformation is the vertical shift, which occurs when a constant k is added to the function. For instance, if you have y = \(\sin\)(x) + 1, the entire graph of y = \(\sin\)(x) shifts upward by 1 unit. This means that the original peaks and valleys will also adjust accordingly. The peak that was at 1 will now be at 2, and the valley that was at -1 will rise to 0.
To summarize, graphing sine and cosine functions involves understanding their periodic nature and how to plot key points derived from the unit circle. Additionally, recognizing how transformations like vertical shifts affect the graphs is crucial for accurately representing these functions. Mastering these concepts will enhance your ability to analyze and interpret trigonometric graphs effectively.