Skip to main content
College Algebra
My Course
Learn
Exam Prep
AI Tutor
Study Guides
Textbook Solutions
Flashcards
Explore
Try the app
My Course
Learn
Exam Prep
AI Tutor
Study Guides
Textbook Solutions
Flashcards
Explore
Try the app
?
Select textbook and Institution
Improve your experience by picking them
Table of contents
Skip topic navigation
0. Review of Algebra
4h 18m
Chapter worksheet
Algebraic Expressions
36m
Exponents
32m
Polynomials Intro
19m
Multiplying Polynomials
36m
Factoring Polynomials
1h 2m
Radical Expressions
15m
Simplifying Radical Expressions
35m
Rationalize Denominator
15m
Rational Exponents
4m
1. Equations & Inequalities
3h 18m
Chapter worksheet
Linear Equations
31m
Rational Equations
21m
The Imaginary Unit
6m
Powers of i
11m
Complex Numbers
36m
Intro to Quadratic Equations
18m
The Square Root Property
11m
Completing the Square
12m
The Quadratic Formula
18m
Choosing a Method to Solve Quadratics
9m
Linear Inequalities
20m
2. Graphs of Equations
1h 43m
Chapter worksheet
Graphs and Coordinates
7m
Two-Variable Equations
23m
Lines
1h 12m
3. Functions
2h 17m
Chapter worksheet
Intro to Functions & Their Graphs
35m
Common Functions
5m
Transformations
45m
Function Operations
21m
Function Composition
29m
4. Polynomial Functions
1h 44m
Chapter worksheet
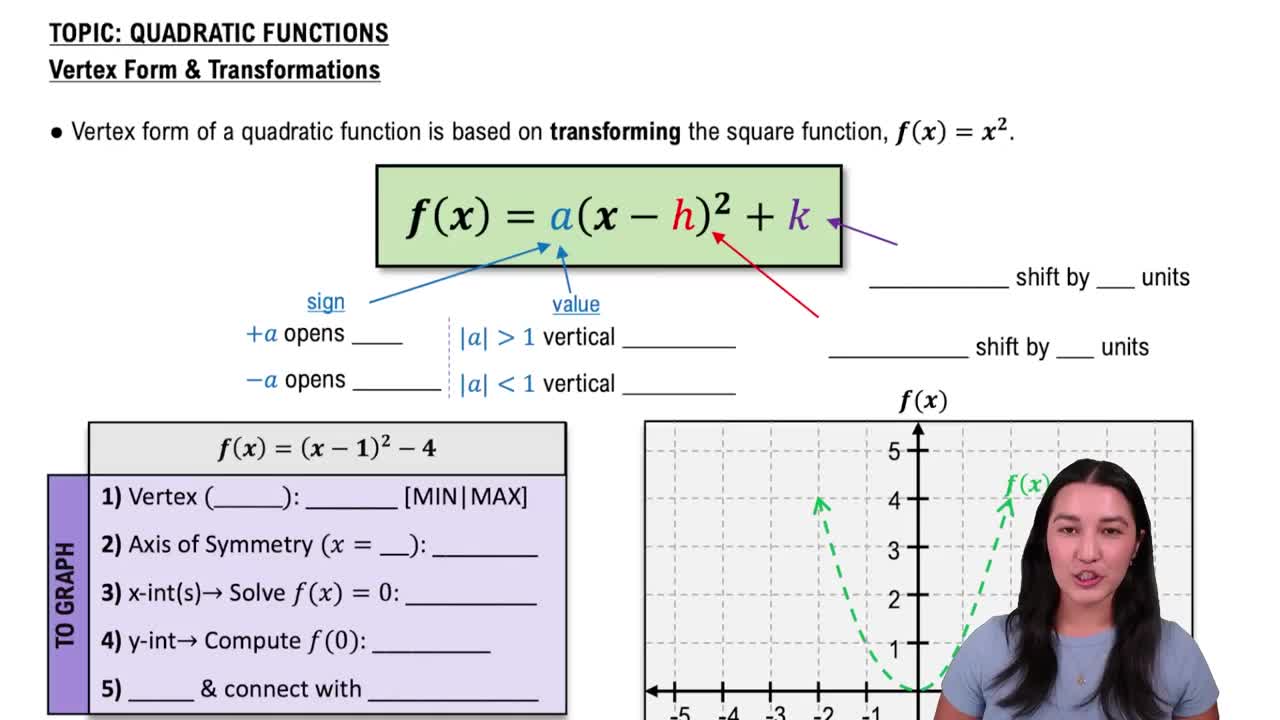
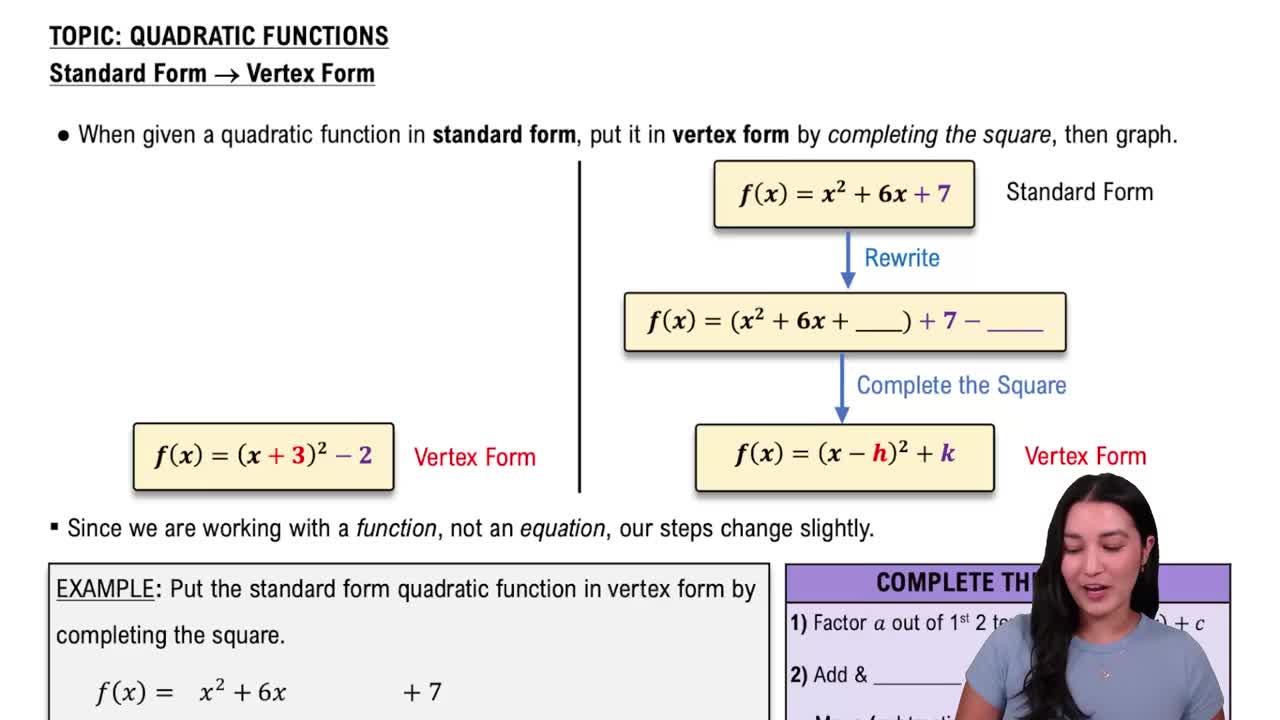
Quadratic Functions
39m
Understanding Polynomial Functions
34m
Graphing Polynomial Functions
30m
Dividing Polynomials
Zeros of Polynomial Functions
5. Rational Functions
1h 23m
Chapter worksheet
Introduction to Rational Functions
9m
Asymptotes
35m
Graphing Rational Functions
38m
6. Exponential & Logarithmic Functions
2h 28m
Chapter worksheet
Introduction to Exponential Functions
9m
Graphing Exponential Functions
25m
The Number e
8m
Introduction to Logarithms
22m
Graphing Logarithmic Functions
18m
Properties of Logarithms
27m
Solving Exponential and Logarithmic Equations
35m
7. Systems of Equations & Matrices
4h 5m
Chapter worksheet
Two Variable Systems of Linear Equations
1h 7m
Introduction to Matrices
1h 11m
Determinants and Cramer's Rule
1h 3m
Graphing Systems of Inequalities
42m
8. Conic Sections
2h 23m
Chapter worksheet
Introduction to Conic Sections
5m
Circles
15m
Ellipses: Standard Form
33m
Parabolas
36m
Hyperbolas at the Origin
40m
Hyperbolas NOT at the Origin
12m
9. Sequences, Series, & Induction
1h 22m
Chapter worksheet
Sequences
40m
Arithmetic Sequences
25m
Geometric Sequences
15m
10. Combinatorics & Probability
1h 45m
Chapter worksheet
Factorials
11m
Combinatorics
46m
Probability
47m
4. Polynomial Functions
Quadratic Functions
College Algebra
4. Polynomial Functions
Quadratic Functions
Previous video
Next video
Struggling with College Algebra?
Join thousands of students who trust us to help them ace their exams!
Watch the first video
Example 1
Callie
Video duration:
7m
Play a video:
Previous video
Next video
Related Videos
Related Practice
02:59
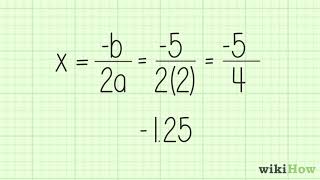
How to Find the Maximum or Minimum Value of a Quadratic Function Easily
2400
views
4
rank
1
comments
Guided course
06:31
Optimization Problem
Pearson
1073
views
07:42
Properties of Parabolas
5597
views
167
rank
2
comments
08:07
Vertex Form
3418
views
119
rank
1
comments
04:34
Converting Standard Form to Vertex Form
2868
views
49
rank
7:49
Example 2
1930
views
51
rank
1
comments
Show more videos


 02:59
02:59