Income Statement Preparation: Videos & Practice Problems
Income Statement Preparation focuses on building an income statement that reports a company’s income for a specific period by comparing sales with costs. A standard format begins with sales, then subtracts cost of goods sold to arrive at gross profit, and then subtracts operating expenses to determine net operating income. Operating expenses may also be described as selling, general, and administrative expenses or non-manufacturing costs.
A central step is computing cost of goods sold from inventory values rather than tracking individual items. The key relationship is \( \text{Cost of Goods Sold} = \text{Beginning Inventory} + \text{New Inventory} - \text{Ending Inventory} \) . Beginning inventory plus new inventory gives goods available for sale. For manufacturers, new inventory is cost of goods manufactured; for merchandising firms, it is inventory purchased.
Inventories and Cost of Goods Sold


Inventories and Cost of Goods Sold
Inventories and Cost of Goods Sold
Jimothy’s Preserves began the year with \$5,000 of finished jam in inventory. During the year they produced \$20,000 of jam and ended the year with \$8,000 in Finished Goods Inventory. What is the Cost of Goods Sold for Jimothy’s Preserves?
\$33,000
\$23,000
\$17,000
\$25,000
Above Average Purchase is an electronics merchandising store. During August they acquire products worth \$50,000. If they started the year with \$10,000 of electronics in inventory, and finished the period with \$30,000 worth of inventory on shelves, what was their Cost of Goods Sold?
\$25,000
\$15,000
\$20,000
\$30,000
Creating an Income Statement
Creating an Income Statement
Jamison’s Jerseys produces replica sports memorabilia. Their cost and sales data are recorded below. What was Jamison’s Jerseys’ Gross Profit for the year?
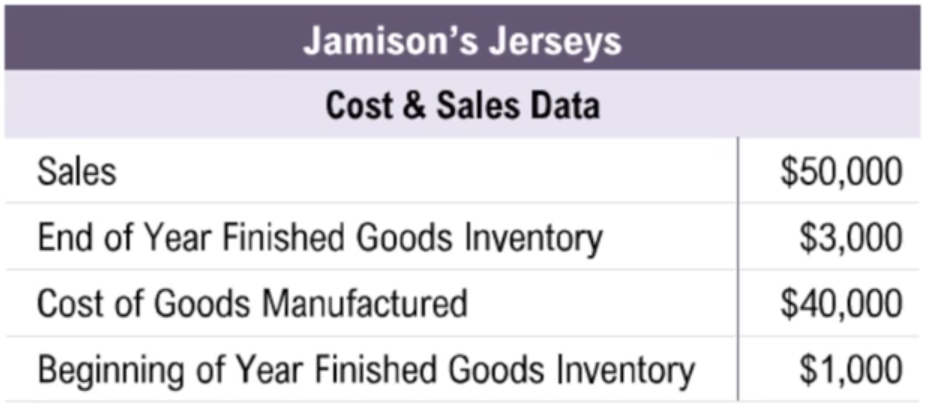
\$12,000
\$6,000
\$8,000
\$10,000
Bill’s Bobbleheads are preparing their income statement for the year. In the past year Bill’s has sold \$20,000 worth of bobbleheads. They finished the year with \$3,000 in inventory, manufactured \$10,000 of products, and began the year with \$8,000 in Finished Goods Inventory. If Bill’s Bobbleheads spent \$1,500 on Operating Expenses during the year, what is their Net Operating Income?
\$3,500
\$5,000
\$6,500
\$10,000
Here's what students ask on this topic:
The formula to calculate cost of goods sold (COGS) using inventory values is: . This means you start with the value of inventory at the beginning of the period, add the value of new inventory acquired or produced during the period, and then subtract the value of inventory remaining at the end of the period. The result represents the cost of inventory that was sold during the period. This approach avoids tracking individual items and is useful for businesses with large or complex inventories.
Manufacturing and merchandising companies differ in how they define "new inventory" in the COGS formula. For manufacturing firms, new inventory is the cost of goods manufactured, which includes the cost of producing products during the period. For merchandising firms, which resell products, new inventory is the value of inventory purchased during the period. Both use the same basic formula: , but the meaning of "new inventory" changes depending on the type of business.
A standard income statement typically includes the following components: (1) Sales or revenue earned during the period; (2) Cost of Goods Sold (COGS), which is subtracted from sales to calculate gross profit; (3) Gross Profit, which is sales minus COGS; (4) Operating Expenses (also called selling, general, and administrative expenses or period costs), which are subtracted from gross profit; and (5) Net Operating Income, which is the final profit after subtracting all costs. The income statement also includes a header with the company name, document title, and period covered.
Gross profit is calculated by subtracting the cost of goods sold (COGS) from total sales. Mathematically, it is expressed as: . This figure represents the profit a company makes after covering the direct costs of producing or purchasing the goods sold, but before deducting operating expenses. Gross profit helps assess how efficiently a company produces or sources its products.
Operating expenses, also known as selling, general, and administrative expenses or period costs, are costs not directly tied to producing goods. In an income statement, operating expenses are subtracted from gross profit to calculate net operating income. This step is important because it accounts for all other costs a business incurs to operate, such as marketing, salaries, and rent. The formula is: . Net operating income reflects the company's profitability after all costs are considered.

