The Contribution Approach Income Statement: Videos & Practice Problems
The Contribution Approach Income Statement reorganizes the income statement for internal decision making by separating variable costs from fixed costs. Unlike a standard income statement that emphasizes gross profit by grouping product and period costs, this format shows how much sales revenue remains after paying costs that change with activity. The key measure is the contribution margin, calculated as \(Sales - Variable\\ Costs\) .
The contribution margin represents the amount available to cover fixed costs and then generate net operating income. In this approach, sales are listed first, variable costs are subtracted to find contribution margin, and fixed costs are then subtracted to arrive at \(Net\\ Operating\\ Income = Contribution\\ Margin - Fixed\\ Costs\) . This format does not change total income compared with a standard income statement, but it provides clearer insight into cost behavior and supports better managerial decisions.
Introduction to the Contribution Margin


Introduction to the Contribution Margin
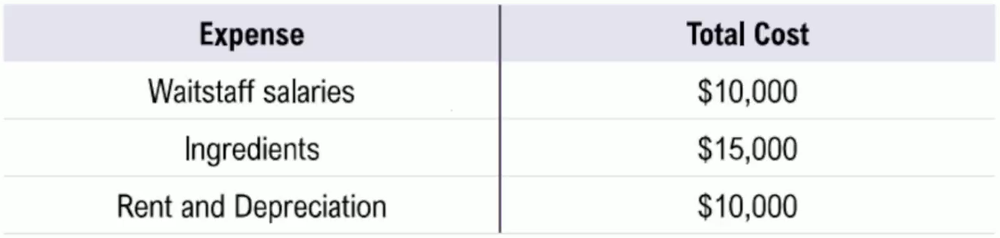
Taco Table is a restaurant with costs listed in the table below. If Taco Table sells 10,000 tacos for \$4 each, what is their contribution margin?
\$10,000
\$15,000
\$20,000
\$25,000
The Contribution Margin Income Statement
The Contribution Margin Income Statement
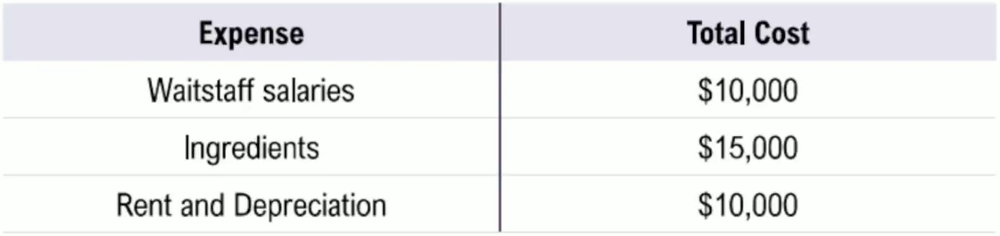
Taco Table is a restaurant with costs listed in the table below. If Taco Table sells 10,000 tacos for \$4 each, what is Taco Table’s net operating income as calculated on a Contribution Margin Income Statement.
\$5,000
\$10,000
\$15,000
\$20,000
Here's what students ask on this topic:
The contribution margin is a key concept in the contribution approach income statement. It represents the amount of sales revenue remaining after subtracting all variable costs. Mathematically, it is expressed as . This margin shows how much money is available to cover fixed costs and then generate net operating income. Unlike a standard income statement, which groups costs differently, the contribution margin helps managers understand how costs behave with changes in sales volume, aiding in better decision-making.
The contribution approach income statement differs from a standard income statement primarily in how costs are classified and presented. While a standard income statement groups costs into product costs and period costs, the contribution approach separates costs into variable and fixed costs. This separation allows the calculation of the contribution margin by subtracting variable costs from sales. Fixed costs are then subtracted from the contribution margin to find net operating income. Although both statements arrive at the same net income, the contribution approach provides clearer insight into cost behavior, which is valuable for internal managerial decision-making.
Variable costs are subtracted before fixed costs in the contribution approach income statement because variable costs directly relate to production and sales volume. They must be paid first to continue operations; for example, paying suppliers for materials ensures production can continue in future periods. The contribution margin, calculated after covering variable costs, shows how much revenue is left to cover fixed costs. Fixed costs, which do not change with production volume, are then subtracted. This order reflects the real-world priority of covering costs that fluctuate with activity before fixed obligations.
The contribution margin income statement aids managerial decision-making by clearly separating variable and fixed costs, which helps managers understand how costs behave with changes in sales volume. By focusing on the contribution margin, managers can see how much revenue is available to cover fixed costs and generate profit. This insight supports decisions such as pricing, budgeting, and cost control. Unlike standard income statements designed for external reporting, the contribution margin format provides internal stakeholders with detailed information to optimize operations and improve profitability.
No, the contribution margin income statement is not typically used for external financial reporting. It is designed primarily for internal managerial use to aid decision-making by separating variable and fixed costs. External financial reports follow Generally Accepted Accounting Principles (GAAP), which do not require or include the contribution margin format. Instead, external reports focus on gross profit and net income without distinguishing costs by behavior, ensuring consistency and comparability for shareholders and regulators.

