The Contribution Margin: Videos & Practice Problems
Contribution Margin is the amount of sales revenue left after paying variable costs. It shows how much is available to cover fixed costs and, after fixed costs are covered, income. This makes it a key measure for managerial decision making because it connects sales activity to profitability and helps managers evaluate how much each sale supports the business.
Two related measures are especially important. Contribution margin per unit shows how much each unit contributes toward fixed costs and income, calculated as \(CM\text{ per unit}=\frac{\text{Total contribution margin}}{\text{Quantity sold}}\) . Contribution margin ratio shows the percentage of each sales dollar available after variable costs, calculated as \(CM\text{ ratio}=\frac{\text{Total contribution margin}}{\text{Total sales}}\) . These measures are useful for assessing break-even and profitability.
Other Contribution Margin Measures


Other Contribution Margin Measures
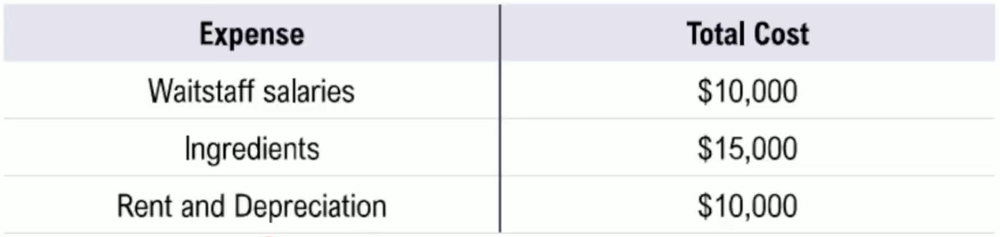
Taco Table is a restaurant with costs listed in the table below. If Taco Table sells 10,000 tacos for \$4 each, what is Taco Table’s contribution margin ratio?
12.5%
25%
37.5%
50%
Here's what students ask on this topic:
The contribution margin is the amount of sales revenue remaining after paying all variable costs. It is important because it shows how much money is available to cover fixed costs and, after those are covered, to generate profit. In managerial accounting, this measure helps managers understand how each sale supports the business financially. By analyzing the contribution margin, managers can make informed decisions about pricing, production levels, and cost control to improve profitability.
The contribution margin per unit represents how much each individual unit sold contributes toward covering fixed costs and generating income. It is calculated by dividing the total contribution margin by the quantity of units sold. Mathematically, it is expressed as: . This value helps businesses determine how many units they need to sell to break even or become profitable.
The contribution margin ratio shows the percentage of each sales dollar that remains after variable costs are paid, which is available to cover fixed costs and profit. It is calculated by dividing the total contribution margin by total sales revenue. The formula is: . For example, if a company has a contribution margin of \$2,275,000 and total sales of \$5,000,000, the ratio is 0.455 or 45.5%. This means 45.5% of each sales dollar contributes to fixed costs and profit.
The break-even point is the sales level at which total revenue equals total costs, resulting in zero profit. Contribution margin helps determine this point by showing how much each unit sold contributes to covering fixed costs. To find the break-even quantity, divide total fixed costs by the contribution margin per unit: . This calculation tells managers how many units must be sold to cover all costs before making a profit.
Understanding contribution margin is crucial for pricing decisions because it reveals how much profit each unit sale generates after variable costs. If the contribution margin is too low, the price may not cover fixed costs and profit goals. By analyzing contribution margin, managers can set prices that ensure each sale contributes sufficiently to fixed costs and profitability. It also helps in evaluating the impact of discounts, cost changes, or product mix adjustments on overall profitability.

