Graphing logarithmic functions can be straightforward, especially since they are the inverse of exponential functions. Understanding this relationship allows us to leverage our knowledge of exponential graphs to effectively graph logarithmic functions.
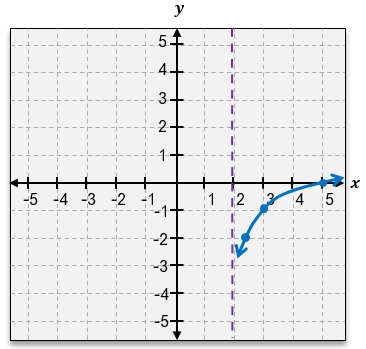
Consider the logarithmic function log2(x). To begin, we can find ordered pairs by substituting values for x. For example, when x = 1, log2(1) = 0, giving us the point (1, 0). Similarly, for x = 2, log2(2) = 1, resulting in the point (2, 1). Notably, these points correspond to the exponential function f(x) = 2x, where the points (0, 1) and (1, 2) can be obtained by flipping the coordinates of the logarithmic points.
This flipping of coordinates is a key feature of inverse functions. Thus, for every point on the exponential graph, you can find a corresponding point on the logarithmic graph by switching the x and y values. This reflection across the line y = x visually illustrates the relationship between the two functions.
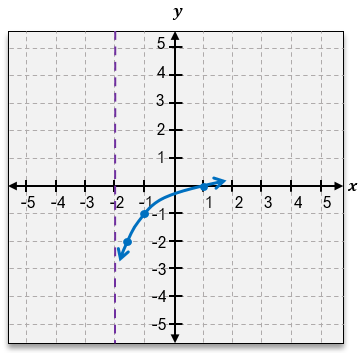
When graphing, it’s important to note the asymptotic behavior. The logarithmic function approaches the vertical asymptote at x = 0 but never touches it, while the exponential function has a horizontal asymptote at y = 0. The domain of the logarithmic function is all real numbers greater than 0, while its range is all real numbers, reflecting the domain and range of the corresponding exponential function.
Additionally, the shape of the graphs can be remembered by visualizing the letters in their names. The graph of an exponential function resembles an extended lowercase "e," while the logarithmic function resembles an extended lowercase "r." This mnemonic can help in recalling the general shapes of these functions.
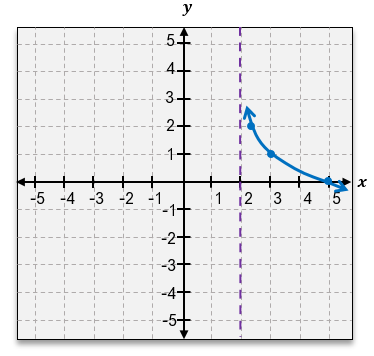
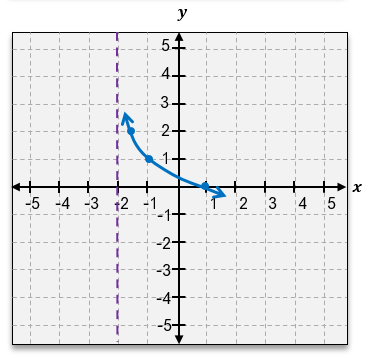
When dealing with logarithmic functions of different bases, the behavior of the graph remains consistent with that of exponential functions. If the base b is greater than 1, the logarithmic function will be increasing. Conversely, if b is between 0 and 1, the function will be decreasing. This consistency reinforces the connection between logarithmic and exponential functions, making it easier to predict their behavior based on the base value.
In summary, understanding the inverse relationship between logarithmic and exponential functions allows for a more intuitive approach to graphing. By flipping coordinates, recognizing asymptotic behavior, and remembering the shapes associated with each function, students can confidently graph logarithmic functions using their knowledge of exponential functions.