Standard deviation is a key statistical measure that indicates how closely data points cluster around the mean (average) value. A smaller standard deviation signifies that the data points are more precise in relation to the mean, while a larger standard deviation indicates greater variability among the data points.
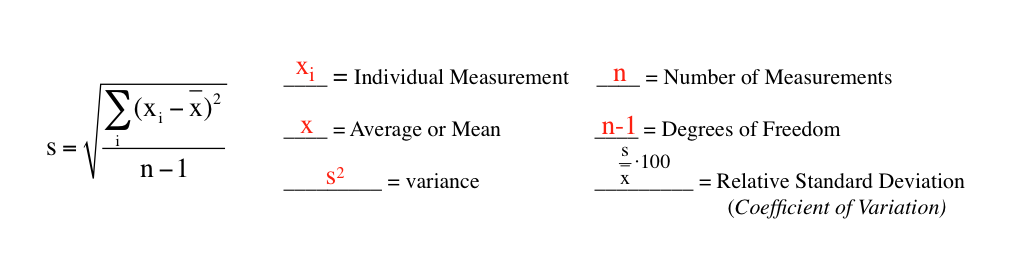
The formula for calculating the standard deviation (s) is given by:
\( s = \sqrt{\frac{\sum (x_i - \bar{x})^2}{n - 1}} \)
In this formula, \( x_i \) represents an individual measurement from the dataset, \( \bar{x} \) (the mean) is the average of all measurements, \( n \) is the total number of measurements, and \( n - 1 \) accounts for the degrees of freedom in the dataset. The variance, which is another important concept, is simply the square of the standard deviation.
Additionally, the relative standard deviation, also known as the coefficient of variation, is calculated by dividing the standard deviation by the mean and multiplying by 100:
\( \text{Coefficient of Variation} = \left( \frac{s}{\bar{x}} \right) \times 100 \)
It is crucial to differentiate between precision and accuracy in measurements. Precision refers to how close the measurements are to each other, while accuracy indicates how close the measurements are to the true value. Therefore, it is possible for measurements to be precise but not accurate if they cluster around a value that is far from the actual true value.
Understanding these concepts is essential for effective statistical analysis, particularly when interpreting data and drawing conclusions based on standard deviation and variance.