The F-test is a statistical method used to compare the variances of two populations. Variance, which is a measure of how much values in a dataset differ from the mean, is calculated as the square of the standard deviation. In the context of the F-test, the F calculated value is derived from the ratio of the squares of the standard deviations of the two populations. Specifically, it is expressed as:
\[F = \frac{{\sigma_1^2}}{{\sigma_2^2}}\]
To ensure that the F calculated value is always equal to or greater than 1, the larger standard deviation should be placed in the numerator. This approach allows for a straightforward comparison between the F calculated value and the F table value, which is derived from statistical tables based on degrees of freedom.
When interpreting the results, if the F calculated value is less than the F table value, it indicates that there is no significant difference between the variances, suggesting that the populations have equal variances. Conversely, if the F calculated value exceeds the F table value, this signifies a significant difference, indicating unequal variances.
In cases of equal variances, the t calculated value can be determined using the formula:
\[t = \frac{{\bar{x}_1 - \bar{x}_2}}{{s_{\text{pooled}}}}\]
where \(\bar{x}_1\) and \(\bar{x}_2\) are the means of the two populations, and \(s_{\text{pooled}}\) is the pooled standard deviation, which accounts for the number of measurements in each population. For unequal variances, a different formula for t calculated is used, and the degrees of freedom must also be calculated accordingly.
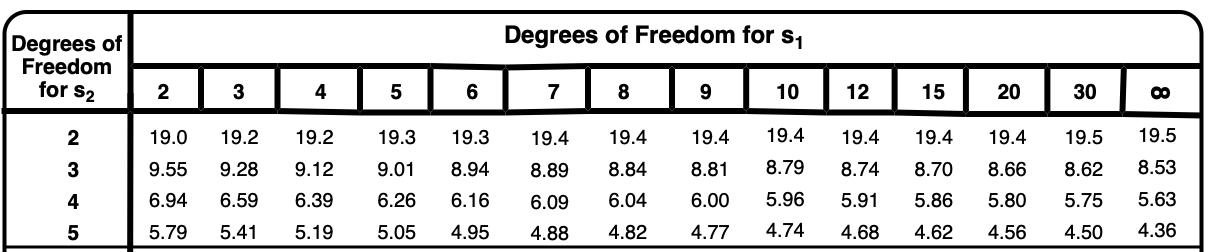
The degrees of freedom for the F-test are determined by the sample sizes of the two populations. Specifically, if \(n_1\) and \(n_2\) are the sample sizes, the degrees of freedom for the numerator (larger standard deviation) is \(n_1 - 1\) and for the denominator is \(n_2 - 1\). This information is crucial for locating the appropriate F table value, which is then compared to the F calculated value to draw conclusions about the variances.
As you delve deeper into the F-test, understanding how to utilize the F table and interpret the results will enhance your statistical analysis skills, particularly in determining the significance of variance differences between populations.