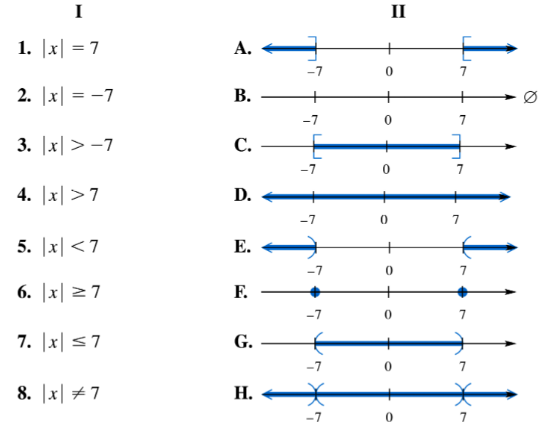
Match each equation or inequality in Column I with the graph ofits solution set in Column II. | x | < 7
Verified step by step guidance
1
Step 1: Understand the inequality \(|x| < 7\). This represents the set of all numbers whose absolute value is less than 7.
Step 2: Recall that the absolute value \(|x|\) represents the distance of \(x\) from 0 on the number line. Therefore, \(|x| < 7\) means \(x\) is within 7 units of 0.
Step 3: Rewrite the inequality \(|x| < 7\) as a compound inequality: \(-7 < x < 7\). This shows that \(x\) is greater than \(-7\) and less than \(7\).
Step 4: Visualize the solution on a number line. The solution set is the interval \((-7, 7)\), which includes all numbers between \(-7\) and \(7\), but not \(-7\) and \(7\) themselves.
Step 5: Match this interval with the corresponding graph in Column II, which should depict an open interval between \(-7\) and \(7\) on the number line.
Verified video answer for a similar problem:
This video solution was recommended by our tutors as helpful for the problem above
Video duration:
1m
Play a video:
Was this helpful?
Key Concepts
Here are the essential concepts you must grasp in order to answer the question correctly.
Inequalities
Inequalities are mathematical expressions that show the relationship between two values when they are not equal. In this case, the inequality 'x < 7' indicates that x can take any value less than 7. Understanding how to interpret and graph inequalities is crucial for visualizing their solution sets.
A number line is a visual representation of numbers in a straight line, where each point corresponds to a number. It is commonly used to illustrate inequalities. For the inequality 'x < 7', the number line would show an open circle at 7, indicating that 7 is not included, and a shaded line extending to the left, representing all numbers less than 7.
Graphing solutions involves plotting the values that satisfy an equation or inequality on a coordinate system. For the inequality 'x < 7', the graph would depict all values to the left of 7 on the number line. This visual representation helps in understanding the range of solutions and is essential for matching equations with their corresponding graphs.