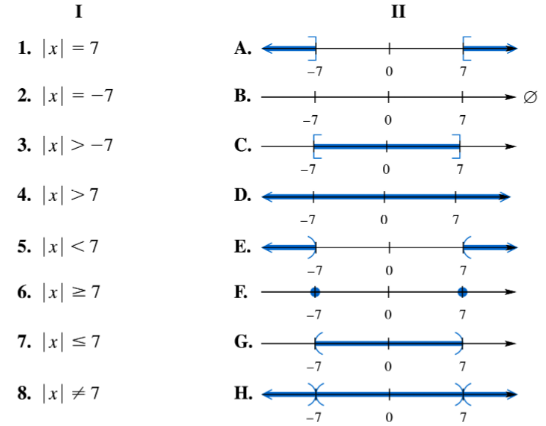
Match each equation or inequality in Column I with the graph ofits solution set in Column II. | x | > 7
Verified step by step guidance
1
Step 1: Understand the absolute value inequality \(|x| > 7\). This means the distance of \(x\) from 0 on the number line is greater than 7.
Step 2: Break down the absolute value inequality into two separate inequalities: \(x > 7\) and \(x < -7\).
Step 3: Recognize that the solution set consists of two intervals: \((7, \infty)\) and \((-\infty, -7)\).
Step 4: Visualize the solution on a number line. The graph will have open circles at \(x = 7\) and \(x = -7\), with shading extending to the right of 7 and to the left of -7.
Step 5: Match this graph with the correct option in Column II that shows two separate rays extending in opposite directions from \(x = 7\) and \(x = -7\).
Verified video answer for a similar problem:
This video solution was recommended by our tutors as helpful for the problem above
Video duration:
3m
Play a video:
Was this helpful?
Key Concepts
Here are the essential concepts you must grasp in order to answer the question correctly.
Inequalities
Inequalities are mathematical expressions that show the relationship between two values when they are not equal. In this case, the inequality 'x > 7' indicates that x can take any value greater than 7. Understanding how to interpret and graph inequalities is crucial for visualizing their solution sets.
Graphing inequalities involves representing the solution set on a number line or coordinate plane. For 'x > 7', the graph would show an open circle at 7, indicating that 7 is not included, and a line extending to the right, representing all values greater than 7. This visual representation helps in understanding the range of solutions.
A solution set is the collection of all values that satisfy a given equation or inequality. For the inequality 'x > 7', the solution set includes all real numbers greater than 7. Recognizing the nature of solution sets is essential for matching them with their corresponding graphs.