Join thousands of students who trust us to help them ace their exams!
Multiple Choice
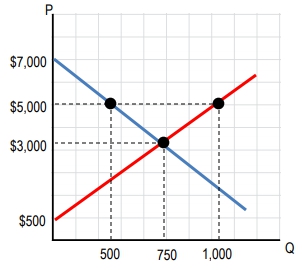
Use the graph for funky-fresh rhymes above. If price increases from \$3,000 to \$5,000 per funky-fresh rhyme, what is the change to consumer surplus?
A
\$500,000 increase
B
\$500,000 decrease
C
\$1,000,000 increase
D
\$1,000,000 decrease
1 Comment
Verified step by step guidance
1
Identify the initial and new prices on the graph. The initial price is \$3,000, and the new price is \$5,000.
Locate the corresponding quantities for these prices on the demand curve. At \$3,000, the quantity is 1,000 units, and at \$5,000, the quantity is 500 units.
Consumer surplus is the area between the demand curve and the price level, up to the quantity demanded. Calculate the initial consumer surplus as the area of the triangle with a base from 0 to 1,000 units and a height from \$3,000 to the intercept of the demand curve.
Calculate the new consumer surplus as the area of the triangle with a base from 0 to 500 units and a height from \$5,000 to the intercept of the demand curve.
The change in consumer surplus is the difference between the initial and new consumer surplus areas. This change represents the decrease in consumer surplus due to the price increase.


 Verified step by step guidance
