Join thousands of students who trust us to help them ace their exams!Watch the first video
Multiple Choice
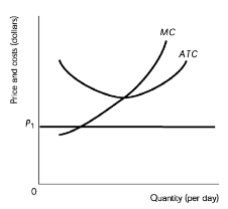
Suppose the cost curves apply to all firms in the industry. If the initial price is P1, in the long run, the market
A
Supply will decrease
B
Demand will decrease
C
Supply will increase
D
Demand will increase
Verified step by step guidance
1
Identify the initial market condition: The graph shows the cost curves for a firm in a perfectly competitive market. The initial price level is P1, which is the horizontal line on the graph.
Analyze the firm's cost structure: The graph includes the Marginal Cost (MC) curve and the Average Total Cost (ATC) curve. In the long run, firms will adjust their output to where the price equals the minimum point of the ATC curve.
Determine the firm's profitability: If the price P1 is above the minimum point of the ATC curve, firms are making a profit. If P1 is below the minimum ATC, firms are incurring losses.
Predict long-run market adjustments: In the long run, if firms are making profits, new firms will enter the market, increasing supply and driving the price down. Conversely, if firms are incurring losses, some firms will exit the market, decreasing supply and driving the price up.
Conclude the market outcome: Based on the initial price P1 and its relation to the ATC curve, determine whether supply will increase or decrease in the long run. If P1 is below the minimum ATC, supply will decrease as firms exit the market.


 Verified step by step guidance