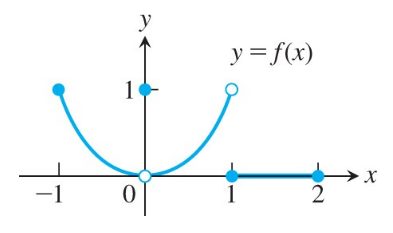
Which of the following statements about the function y = f(x) graphed here are true, and which are false?
j. limx→2− f(x) = 2
Verified step by step guidance
1
To determine the limit of the function as x approaches 2 from the left, we need to analyze the graph of the function y = f(x) near x = 2.
Look at the values of f(x) as x approaches 2 from values less than 2 (i.e., from the left side). This is denoted as limx→2− f(x).
Observe the behavior of the graph as x gets closer to 2 from the left. Check if the y-values are approaching a specific number.
If the y-values are approaching 2 as x approaches 2 from the left, then the statement limx→2− f(x) = 2 is true.
If the y-values are approaching a number other than 2, or if the graph does not approach a specific value, then the statement is false.
Verified video answer for a similar problem:
This video solution was recommended by our tutors as helpful for the problem above
Video duration:
3m
Play a video:
0 Comments
Key Concepts
Here are the essential concepts you must grasp in order to answer the question correctly.
Limits
A limit is a fundamental concept in calculus that describes the behavior of a function as its input approaches a certain value. It helps in understanding how functions behave near specific points, even if they are not defined at those points. For example, the limit of f(x) as x approaches 2 from the left (denoted as lim x→2− f(x)) examines the values of f(x) as x gets closer to 2 from values less than 2.
One-sided limits refer to the limits of a function as the input approaches a specific value from one side only. The left-hand limit (lim x→c− f(x)) considers values approaching c from the left, while the right-hand limit (lim x→c+ f(x)) considers values approaching c from the right. Understanding one-sided limits is crucial for analyzing functions that may have different behaviors from each side of a point.
Graphical interpretation of limits involves analyzing the graph of a function to determine the value that the function approaches as the input approaches a certain point. By observing the behavior of the graph near that point, one can infer the limit. This visual approach is particularly useful for identifying discontinuities or jumps in the function, which can affect the limit's value.

 Verified step by step guidance
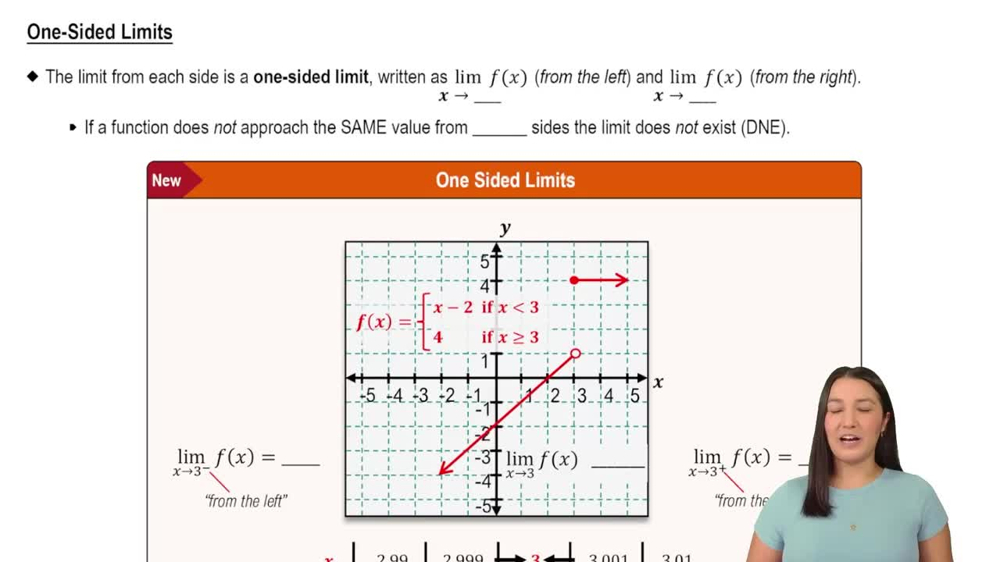
 05:50
05:50