Textbook Question
Witch of Agnesi Let y(x²+4)=8 (see figure). <IMAGE>
d. Verify that the results of parts (a) and (c) are consistent.
274
views

 Verified step by step guidance
 05:44
05:44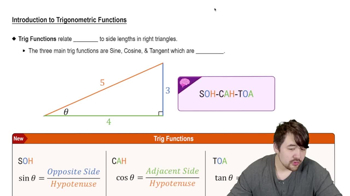 6:04
6:04 05:03
05:03Witch of Agnesi Let y(x²+4)=8 (see figure). <IMAGE>
d. Verify that the results of parts (a) and (c) are consistent.
97–100. Logistic growth Scientists often use the logistic growth function P(t) = P₀K / P₀+(K−P₀)e^−r₀t to model population growth, where P₀ is the initial population at time t=0, K is the carrying capacity, and r₀ is the base growth rate. The carrying capacity is a theoretical upper bound on the total population that the surrounding environment can support. The figure shows the sigmoid (S-shaped) curve associated with a typical logistic model. <IMAGE>
{Use of Tech} Gone fishing When a reservoir is created by a new dam, 50 fish are introduced into the reservoir, which has an estimated carrying capacity of 8000 fish. A logistic model of the fish population is P(t) = 400,000 / 50+7950e^−0.5t, where t is measured in years.
d. Graph P' and use the graph to estimate the year in which the population is growing fastest.
The table gives the position s(t)of an object moving along a line at time t, over a two-second interval. Find the average velocity of the object over the following intervals. <IMAGE>
c.
Derivatives using tables Let and . Use the table to compute the following derivatives.
<IMAGE>
e.
The table gives the position s(t)of an object moving along a line at time t, over a two-second interval. Find the average velocity of the object over the following intervals. <IMAGE>
a.
A rectangular swimming pool 10 ft wide by 20 ft long and of uniform depth is being filled with water.
b. At what rate is the volume of the water increasing if the water level is rising at 1/4ft/min.