Sketch the graph of a continuous function ƒ on [0, 4] satisfying the given properties.
ƒ' (x) and ƒ'3 are undefined; ƒ'(2) = 0; has a local maximum at x= 1; ƒ has local minimum at x = 2; and ƒ has an absolute maximum at x= 3; and ƒ has an absolute minimum at x = 4 .
Verified step by step guidance
1
Identify the critical points and intervals based on the given properties. The critical points are x = 1, x = 2, x = 3, and x = 4. The intervals to consider are [0, 1], [1, 2], [2, 3], and [3, 4].
Analyze the behavior of the function on each interval. Since ƒ'(2) = 0, the function has a horizontal tangent at x = 2, indicating a local minimum. At x = 1, the function has a local maximum, so the derivative changes from positive to negative.
Consider the absolute maximum at x = 3. This means that the function value at x = 3 is greater than or equal to the function values at all other points in the interval [0, 4].
Note that the function has an absolute minimum at x = 4. This implies that the function value at x = 4 is less than or equal to the function values at all other points in the interval [0, 4].
Sketch the graph by plotting the critical points and ensuring the function is continuous. Start with a local maximum at x = 1, decrease to a local minimum at x = 2, increase to an absolute maximum at x = 3, and finally decrease to an absolute minimum at x = 4.
Verified video answer for a similar problem:
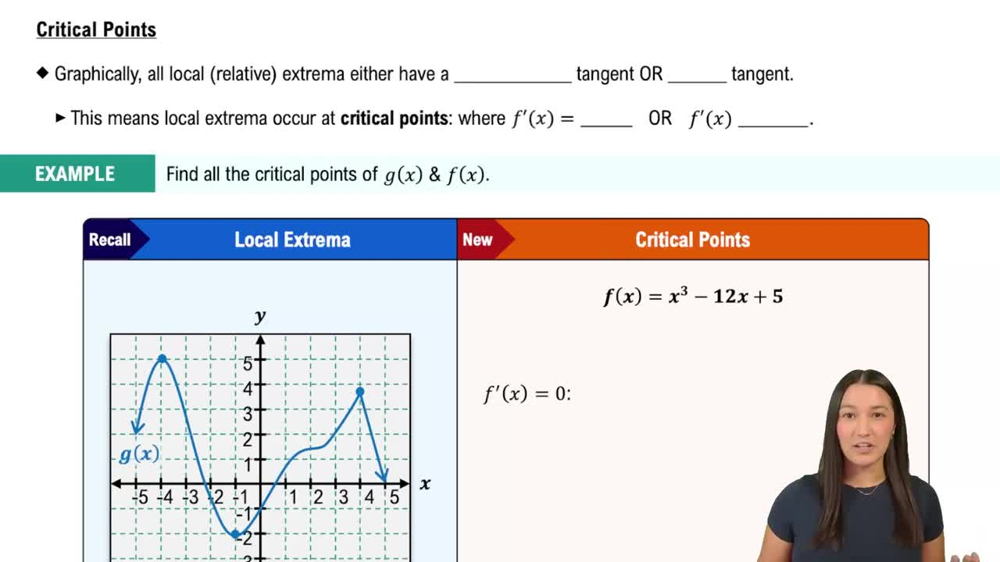
This video solution was recommended by our tutors as helpful for the problem above
Video duration:
7m
Play a video:
0 Comments
Key Concepts
Here are the essential concepts you must grasp in order to answer the question correctly.
Derivative and Critical Points
The derivative of a function, denoted as ƒ'(x), represents the rate of change of the function at a given point. Critical points occur where the derivative is zero or undefined, indicating potential local maxima, minima, or points of inflection. In this question, understanding that ƒ'(2) = 0 and that ƒ' is undefined at certain points is crucial for identifying where the function changes behavior.
Local extrema refer to points where a function reaches a maximum or minimum value within a specific interval, while absolute extrema are the highest or lowest values of the function over its entire domain. The question specifies that there is a local maximum at x=1, a local minimum at x=2, an absolute maximum at x=3, and an absolute minimum at x=4, which guides the sketching of the function's graph.
A function is continuous if there are no breaks, jumps, or holes in its graph over a given interval. For the function ƒ on [0, 4], continuity is essential to ensure that the graph can be drawn without lifting the pencil. This property, combined with the specified critical points and extrema, helps in accurately sketching the function's behavior across the interval.