Textbook Question
Shifting and Scaling Graphs
Suppose the graph of g is given. Write equations for the graphs that are obtained from the graph of g by shifting, scaling, or reflecting, as indicated.
e. Stretch vertically by a factor of 5
352
views

 Verified step by step guidance
 5:53
5:53 06:37
06:37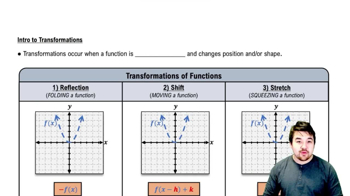 5:25
5:25Shifting and Scaling Graphs
Suppose the graph of g is given. Write equations for the graphs that are obtained from the graph of g by shifting, scaling, or reflecting, as indicated.
e. Stretch vertically by a factor of 5
Graph ƒ₁ and ƒ₂ together. Then describe how applying the absolute value function in ƒ₂ affects the graph of ƒ₁.
ƒ₁(x) ƒ₂(x)
x² |x|²
Graph ƒ₁ and ƒ₂ together. Then describe how applying the absolute value function in ƒ₂ affects the graph of ƒ₁.
ƒ₁(x) ƒ₂(x)
4 - x² |4 - x²|
In Exercises 41 and 42, (a) write formulas for ƒ ○ g and g ○ ƒ and find the (b) domain and (c) range of each.
ƒ(x) = 2 - x², g(x) = √ x + 2
Composition of Functions
In Exercises 39 and 40, find
d. (g ○ g) (x).
ƒ(x) = 1/x , g(x) = 1/√ x + 2
Graph ƒ₁ and ƒ₂ together. Then describe how applying the absolute value function in ƒ₂ affects the graph of ƒ₁.
ƒ₁(x) ƒ₂(x)
__ ___
√ x √ |x|