Textbook Question
17–32. Solving initial value problems Determine whether the following equations are separable. If so, solve the initial value problem.
y'(t) = cos² y, y(1) = π/4
30
views

 Verified step by step guidance
 06:30
06:30 5:53
5:53 06:16
06:1617–32. Solving initial value problems Determine whether the following equations are separable. If so, solve the initial value problem.
y'(t) = cos² y, y(1) = π/4
5–16. Solving separable equations Find the general solution of the following equations. Express the solution explicitly as a function of the independent variable.
y'(t) = eʸᐟ²sin t
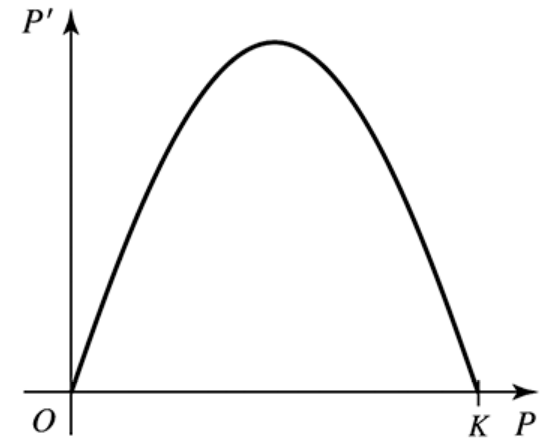
Solution of the logistic equation Use separation of variables to show that the solution of the initial value problem
P'(t) = rP (1-P/K), P(0) = P₀
is P(t) = K/((K/P₀ − 1)e⁻ʳᵗ + 1)
33–42. Solving initial value problems Solve the following initial value problems.
y'(t) = 1 + eᵗ, y(0) = 4
23–26. Loan problems The following initial value problems model the payoff of a loan. In each case, solve the initial value problem, for t≥0 graph the solution, and determine the first month in which the loan balance is zero.
B′(t) = 0.005B − 500, B(0) = 50,000
15–16. {Use of Tech} Solving logistic equations Write a logistic equation with the following parameter values. Then solve the initial value problem and graph the solution. Let r be the natural growth rate, K the carrying capacity, and P₀ the initial population.
r=0.2, K=300, P₀=50