Join thousands of students who trust us to help them ace their exams!
Multiple Choice
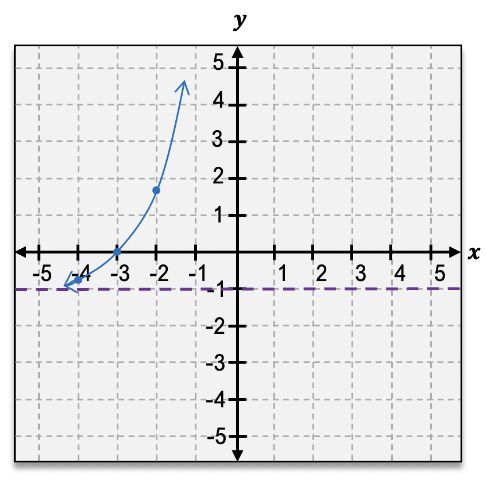
Graph the given function. g(x)=ex+3−1
A
B
C
D
0 Comments
Verified step by step guidance
1
Identify the function to be graphed: \( g(x) = e^{x+3} - 1 \). This is an exponential function with a horizontal shift and a vertical shift.
Recognize the transformations: The function \( e^x \) is shifted horizontally to the left by 3 units due to \( x+3 \), and vertically down by 1 unit due to the \(-1\).
Determine the horizontal asymptote: The horizontal asymptote of \( e^x \) is \( y = 0 \). After the vertical shift, the new horizontal asymptote is \( y = -1 \).
Plot key points: Calculate a few key points by substituting values of \( x \) into \( g(x) \). For example, when \( x = -3 \), \( g(-3) = e^{0} - 1 = 0 \). When \( x = -2 \), \( g(-2) = e^{1} - 1 \). Continue for other values to get a sense of the curve.
Sketch the graph: Draw the curve starting from the left, approaching the horizontal asymptote \( y = -1 \) as \( x \) goes to negative infinity, and rising steeply as \( x \) increases, reflecting the exponential growth.


 Verified step by step guidance
