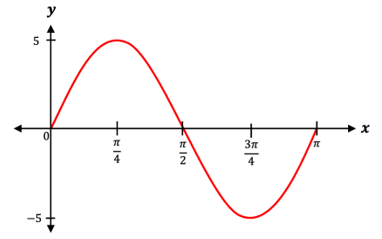
Understanding the concavity of a function is essential in analyzing its behavior. The concavity is determined by the sign of the second derivative of the function. When the second derivative is positive, the function is said to be concave up, resembling a smiley face on a graph. Conversely, when the second derivative is negative, the function is concave down, resembling a frowning face. This visual representation aids in recognizing the concavity of a function.
The first derivative of a function indicates its slope or rate of change. The second derivative, therefore, represents the rate of change of the first derivative, essentially describing how the slope itself is changing. For instance, if the slope is increasing, the second derivative is positive, indicating concavity upwards. If the slope is decreasing, the second derivative is negative, indicating concavity downwards.
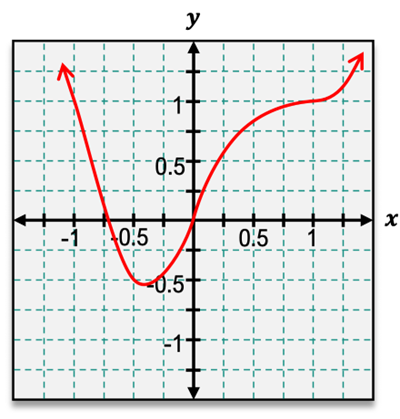
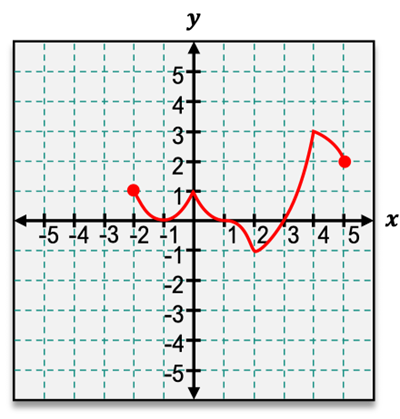
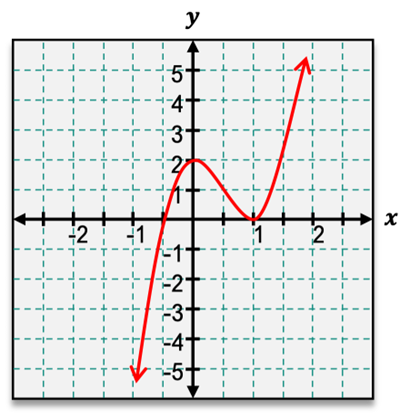
When analyzing a graph, tangent lines can be drawn to observe the behavior of the slope. In regions where the function is concave up, the tangent lines lie below the curve, while in concave down regions, the tangent lines lie above the curve. A critical point in this analysis is the inflection point, where the function changes concavity. At an inflection point, the second derivative is either zero or does not exist, similar to critical points for the first derivative.
To identify intervals of concavity and points of inflection, one can examine the graph from left to right. For example, if a function starts off concave down and transitions to concave up, the point where this change occurs is an inflection point. This process can be repeated to find all intervals of concavity and their corresponding inflection points.
In summary, the concavity of a function provides insight into its behavior, and understanding the relationship between the second derivative and concavity is crucial for deeper mathematical analysis.