12. Regression
Regression Readout of the Data Analysis Toolpak - Excel Bonus
 09:50
09:50
Practice this topic
- Multiple Choice
The creators of a program that promises to improve typing speed collect data on the time spent on the program (in hrs) and typing speed (in wpm) of a random sample of 25 users to see if there is linear correlation between the two variables. Use the Data Analysis Toolpak to answer the questions below.
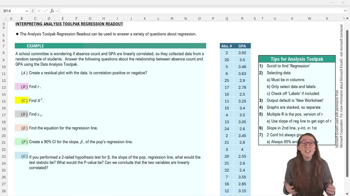
Get the regression readout and create a residual plot with the data. Is correlation positive or negative?
96views - Multiple Choice
The creators of a program that promises to improve typing speed collect data on the time spent on the program (in hrs) and typing speed (in wpm) of a random sample of 25 users to see if there is linear correlation between the two variables. Use the Data Analysis Toolpak to answer the questions below.
Find .
114views - Multiple Choice
The creators of a program that promises to improve typing speed collect data on the time spent on the program (in hrs) and typing speed (in wpm) of a random sample of 25 users to see if there is linear correlation between the two variables. Use the Data Analysis Toolpak to answer the questions below.
Find .
103views - Multiple Choice
The creators of a program that promises to improve typing speed collect data on the time spent on the program (in hrs) and typing speed (in wpm) of a random sample of 25 users to see if there is linear correlation between the two variables. Use the Data Analysis Toolpak to answer the questions below.
Find .
110views1rank