Table of contents
- 1. Intro to Stats and Collecting Data
- 2. Describing Data with Tables and Graphs
- 3. Describing Data Numerically
- 4. Probability
- 5. Binomial Distribution & Discrete Random Variables
- 6. Normal Distribution and Continuous Random Variables
- 7. Sampling Distributions & Confidence Intervals: Mean
- Sampling Distribution of the Sample Mean and Central Limit Theorem
- Distribution of Sample Mean - ExcelBonus
- Introduction to Confidence Intervals
- Confidence Intervals for Population Mean
- Determining the Minimum Sample Size Required
- Finding Probabilities and T Critical Values - ExcelBonus
- Confidence Intervals for Population Means - ExcelBonus
- 8. Sampling Distributions & Confidence Intervals: Proportion
- 9. Hypothesis Testing for One Sample
- Steps in Hypothesis Testing
- Performing Hypothesis Tests: Means
- Hypothesis Testing: Means - ExcelBonus
- Performing Hypothesis Tests: Proportions
- Hypothesis Testing: Proportions - ExcelBonus
- Performing Hypothesis Tests: Variance
- Critical Values and Rejection Regions
- Link Between Confidence Intervals and Hypothesis Testing
- Type I & Type II Errors
- 10. Hypothesis Testing for Two Samples
- Two Proportions
- Two Proportions Hypothesis Test - ExcelBonus
- Two Means - Unknown, Unequal Variance
- Two Means - Unknown Variances Hypothesis Test - ExcelBonus
- Two Means - Unknown, Equal Variance
- Two Means - Unknown, Equal Variances Hypothesis Test - ExcelBonus
- Two Means - Known Variance
- Two Means - Sigma Known Hypothesis Test - ExcelBonus
- Two Means - Matched Pairs (Dependent Samples)
- Matched Pairs Hypothesis Test - ExcelBonus
- Two Variances and F Distribution
- Two Variances - Graphing CalculatorBonus
- 11. Correlation
- 12. Regression
- Linear Regression & Least Squares Method
- Residuals
- Coefficient of Determination
- Regression Line Equation and Coefficient of Determination - ExcelBonus
- Finding Residuals and Creating Residual Plots - ExcelBonus
- Inferences for Slope
- Enabling Data Analysis ToolpakBonus
- Regression Readout of the Data Analysis Toolpak - ExcelBonus
- Prediction Intervals
- Prediction Intervals - ExcelBonus
- Multiple Regression - ExcelBonus
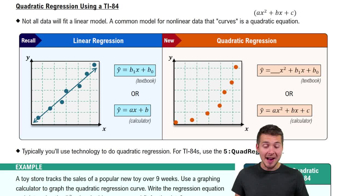
- Quadratic Regression
- Quadratic Regression - ExcelBonus
- 13. Chi-Square Tests & Goodness of Fit
- 14. ANOVA
12. Regression
Quadratic Regression
12. Regression
Quadratic Regression
 07:11
07:11
Practice this topic
- Multiple Choice
For the data points in the graphs below, which most likely suggests a quadratic relationship?
140views - Multiple Choice
The data below shows the population of a small town (in 1000s) over a 9 year period. Using a graphing calculator, determine the linear & quadratic regression curves. Compare their values. Which model is a better fit for the data?
122views - Multiple ChoiceIn quadratic regression with one predictor, what is the general form of the regression equation relating response to predictor ?65views