8. Sampling Distributions & Confidence Intervals: Proportion
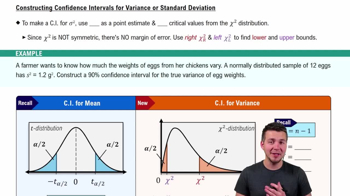
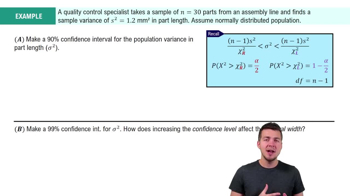
Confidence Intervals for Population Variance
Practice this topic
- Multiple Choice
What is wrong with expressing the confidence interval as ?
32views - Multiple Choice
A delivery service tracks the weights of its packages. A sample of 20 packages has a variance of 4.5 lbs2. Construct a 95% conf. int. for the population variance. Assume a normal distribution.
32views - Multiple ChoiceIn the context of confidence intervals for a population variance , can a (population or sample) variance ever be negative?18views
- Textbook Question
Use the given information to find the number of degrees of freedom, the critical values X2L and X2R, and the confidence interval estimate of σ. It is reasonable to assume that a simple random sample has been selected from a population with a normal distribution:
Nicotine in Menthol Cigarettes 95% confidence; n = 25, s = 0.24 mg
96views - Textbook Question
use the given information to find the number of degrees of freedom, the critical values X2L and X2R, and the confidence interval estimate of σ. It is reasonable to assume that a simple random sample has been selected from a population with a normal distribution:
Heights of Men 99% confidence; n=153, s=7.10 cm.
99views - Textbook Question
Body Temperature Data Set 5 “Body Temperatures” in Appendix B includes a sample of 106 body temperatures having a mean of and a standard deviation of 0.62F (for day 2 at 12 AM). Construct a 95% confidence interval estimate of the standard deviation of the body temperatures for the entire population.
94views - Textbook Question
Large Data Sets from Appendix B. In Exercises 21 and 22, use the data set in Appendix B. Assume that each sample is a simple random sample obtained from a population with a normal distribution.
Comparing Waiting Lines Refer to Data Set 30 “Queues” in Appendix B. Construct separate 95% confidence interval estimates of using the two-line wait times and the single-line wait times. Do the results support the expectation that the single line has less variation? Do the wait times from both line configurations satisfy the requirements for confidence interval estimates of sigma
72views