10. Hypothesis Testing for Two Samples
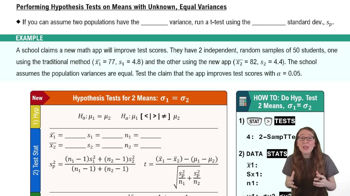
Two Means - Unknown, Equal Variance
 06:20
06:20
Practice this topic
- Multiple Choice
For , & , perform a hypothesis test to test the claim that , assuming for .
72views - Textbook Question
Find the critical value(s) for the alternative hypothesis, level of significance , and sample sizes and . Assume that the samples are random and independent, the populations are normally distributed, and the population variances are (a) equal
Ha:μ1≠μ2 , α=0.10 , n1=11 , n2=14
7views - Textbook Question
Find the critical value(s) for the alternative hypothesis, level of significance , and sample sizes and . Assume that the samples are random and independent, the populations are normally distributed, and the population variances are (a) equal
Ha:μ1<μ2 , α=0.05 , n1=7 , n2=11
10views - Textbook Question
Find the critical value(s) for the alternative hypothesis, level of significance , and sample sizes and . Assume that the samples are random and independent, the populations are normally distributed, and the population variances are (a) equal
Ha:μ1≠μ2 , α=0.01 , n1=19 , n2=22
6views - Textbook Question
Find the critical value(s) for the alternative hypothesis, level of significance , and sample sizes and . Assume that the samples are random and independent, the populations are normally distributed, and the population variances are (a) equal .
Ha:μ1<μ2 , α=0.10 , n1=30 , n2=32
8views