Understanding the relationship between two variables is crucial in data analysis, and one effective way to quantify this relationship is through the use of correlation coefficients. The correlation coefficient, often denoted as r, is a numerical value that ranges from -1 to 1. This value provides insight into both the direction and strength of the correlation between the variables being analyzed.
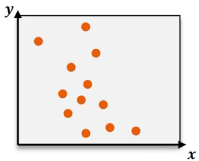
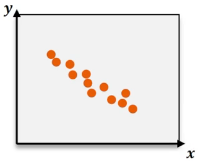
The direction of the correlation is indicated by the sign of r. A positive correlation, where the variables move in the same direction, corresponds to a positive r value, while a negative correlation, where one variable increases as the other decreases, corresponds to a negative r value. For instance, an r value of -0.96 suggests a strong negative correlation, indicating that as one variable increases, the other decreases significantly.
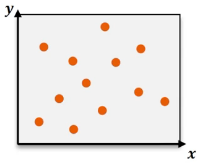
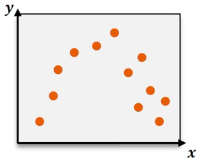
Strength of correlation is assessed by how closely the data points cluster around a line of best fit. A strong correlation is characterized by data points that are tightly packed around the line, resulting in an r value close to either -1 or 1. Conversely, an r value near 0 indicates weak or no correlation, where data points are scattered without a discernible trend. For example, an r value of 0.13 suggests a very weak positive correlation, while an r value of 0.64 indicates a moderate positive correlation, where some trend is present but the data points are not tightly clustered.
It is important to note that the steepness of the slope of the line of best fit does not influence the value of r. The correlation coefficient is solely determined by the degree of clustering of the data points around the line. Therefore, a steeper slope can have a lower r value if the data points are more dispersed compared to a shallower slope with tightly clustered points.
In summary, correlation coefficients are a powerful tool for quantifying the relationship between two variables, providing insights into both the direction and strength of their correlation. Understanding how to interpret these values is essential for effective data analysis and interpretation.